
In last week’s Chart of the Week, we highlighted the resurgence in materials sector breadth—a condition last observed in 2016. That trend strengthened further this week, with 88% of materials stocks now showing rising 200-day moving averages, signaling an established long-term uptrend. At the same time, energy joined the party, with 86% of its stocks now with rising 200-day averages.
The convergence of these two commodity-sensitive sectors prompted a natural question: When was the last time we saw this type of synchronized backdrop?
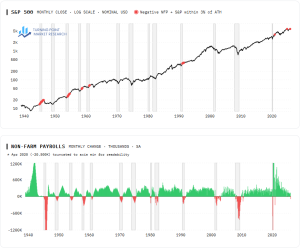
Notably, the Bloomberg Spot Commodity Index also closed at a fresh multi-year high on Friday. To take the analysis further, we identified periods when both sectors exceeded the 85% threshold while the commodity index reached at least a three-year high, highlighted by red dots on the index.
The historical precedents offer a mixed message—some analogs align with the end of an advance, while others resemble the early stages of a new one. We believe the current scenario favors the latter.
The next critical clue is likely to come from the dollar index and crude oil. Stay tuned.

Each Chart of the Week highlights a theme, idea, or historic event that stood out to us. If you find it interesting, feel free to share it with friends or colleagues.
Visit www.tpmarketresearch.com to learn more about our research offering.