
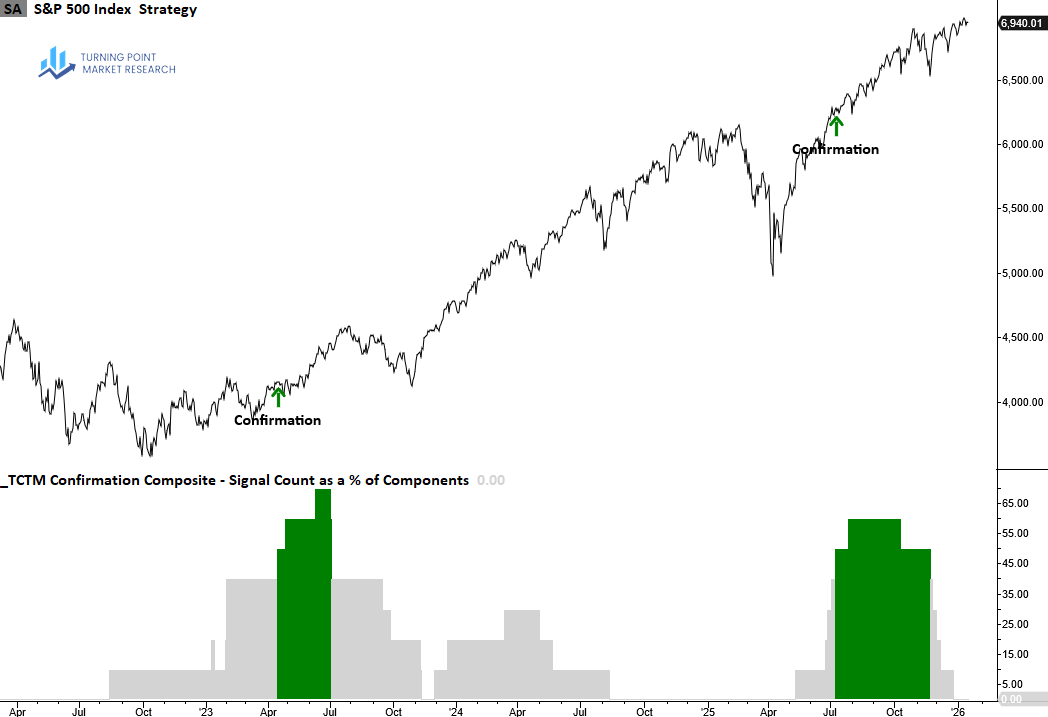
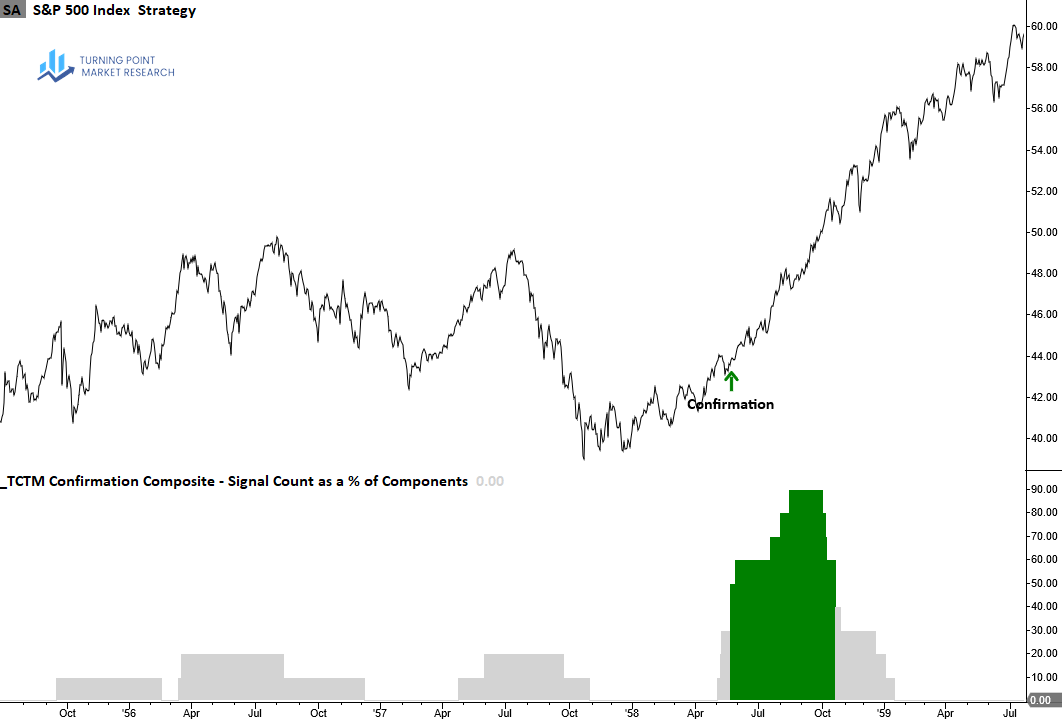
Tactical Composite Trend Model – Confirmation Composite
The Confirmation Composite confirms the durability of a recovery by verifying that long-term measures of market breadth, index price trends and momentum have shifted from bearish to bullish conditions, suggesting the new uptrend will persist.
Composite Construction and Signals
The composite integrates ten independent inputs derived from market breadth, index price behavior, trend-following measures, and momentum indicators. Breadth components are based on S&P 500 constituents and sub-industry groups, while price and momentum measures are taken from the S&P 500 Index itself.
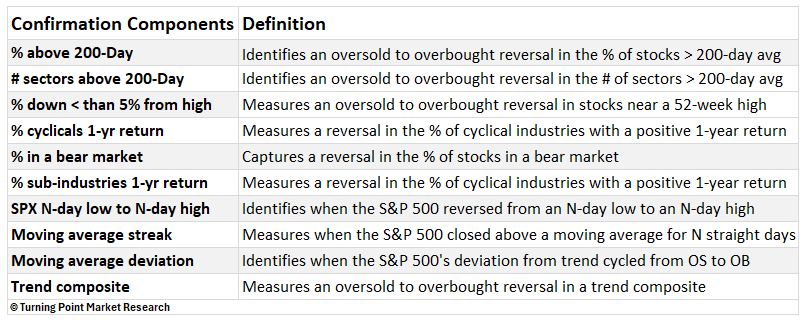
How it works
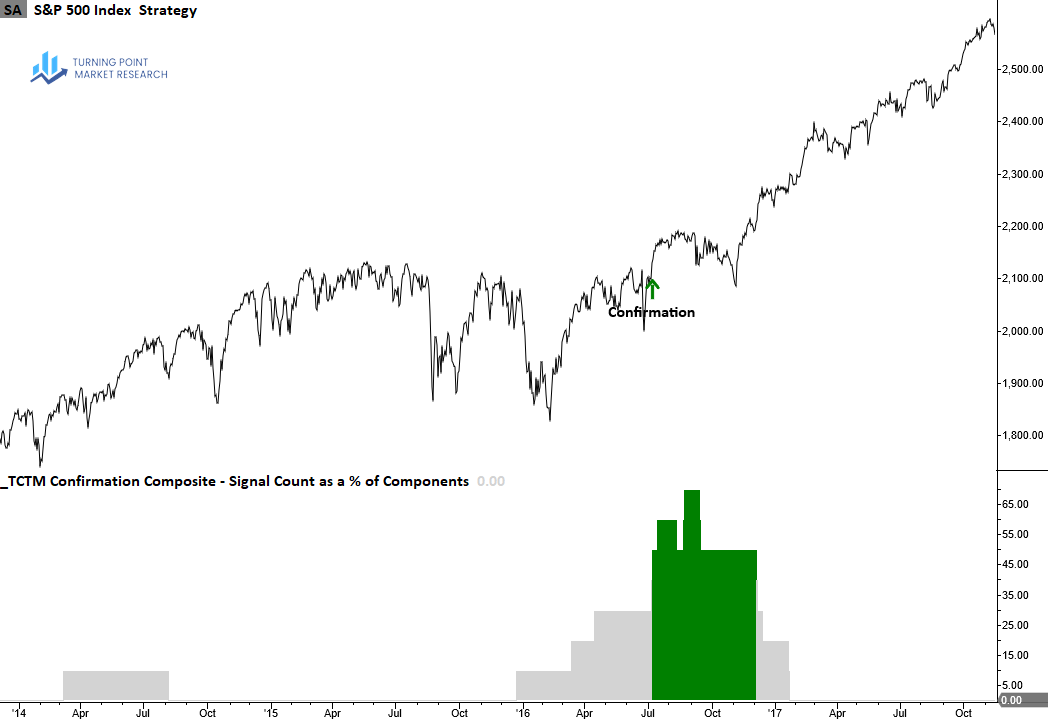
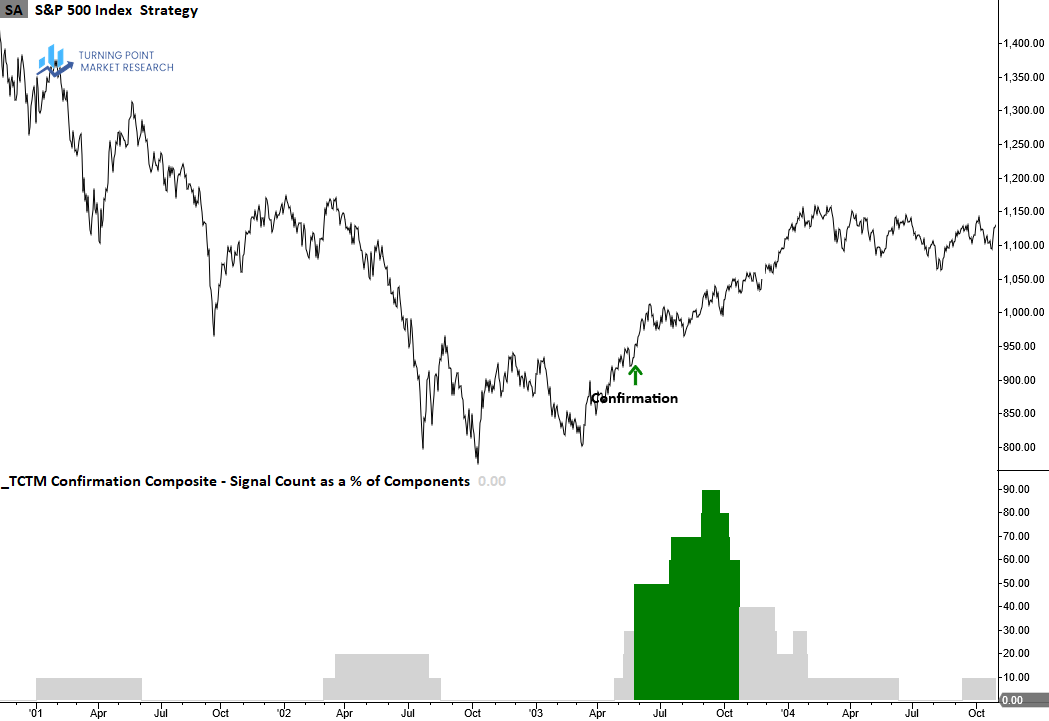
Using a voting system, the composite tallies the number of components that have generated an alert over a five-month rolling window. A signal is generated once five or more components, representing at least 50% of the total members, issue alerts. These signals, while not as timely as thrust alerts, provide additional evidence of a meaningful trend change.
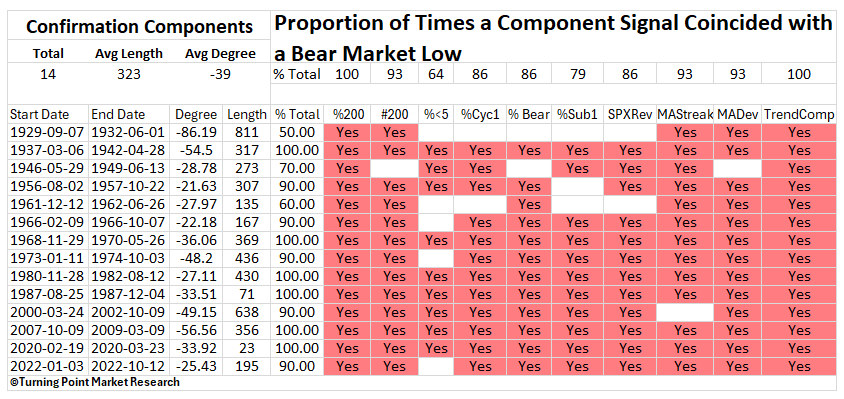
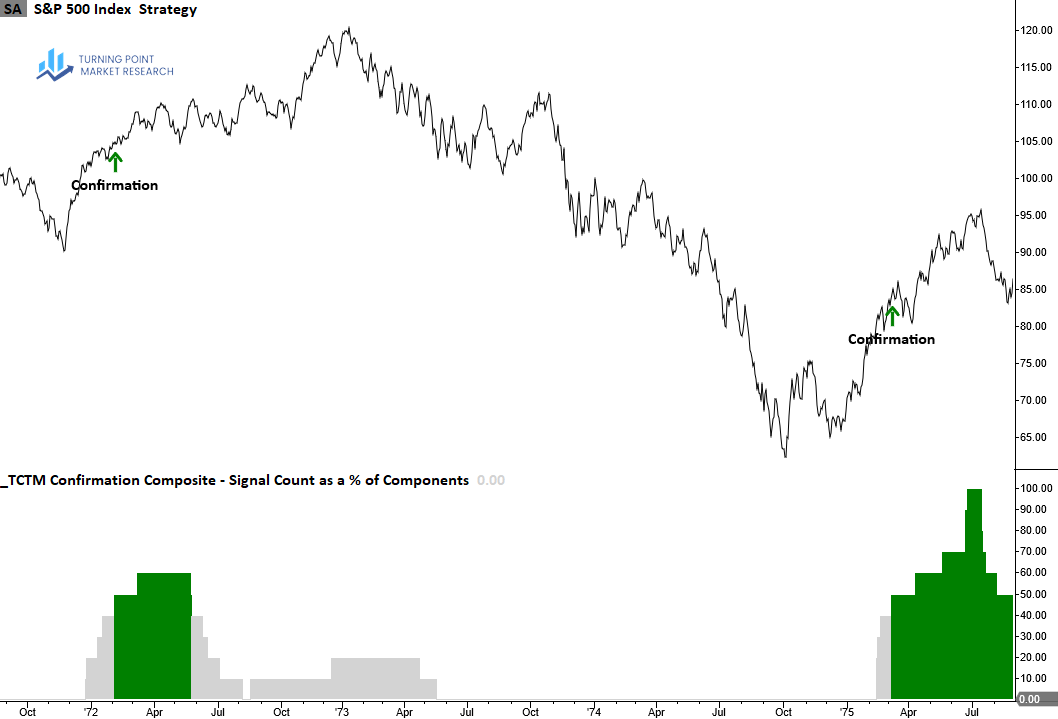
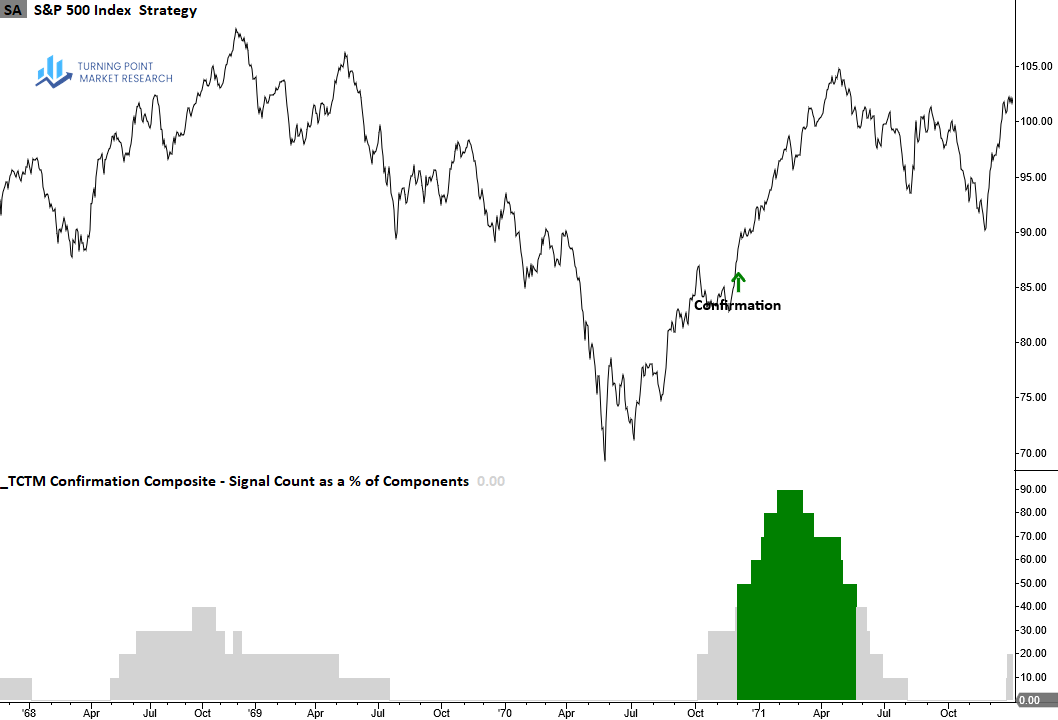
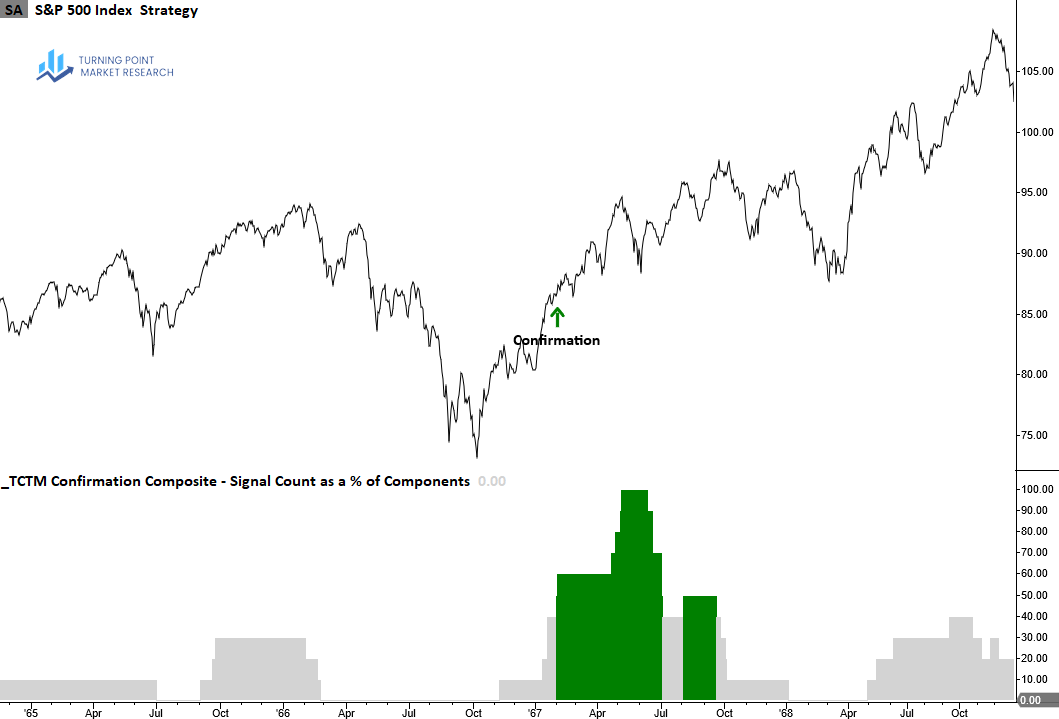
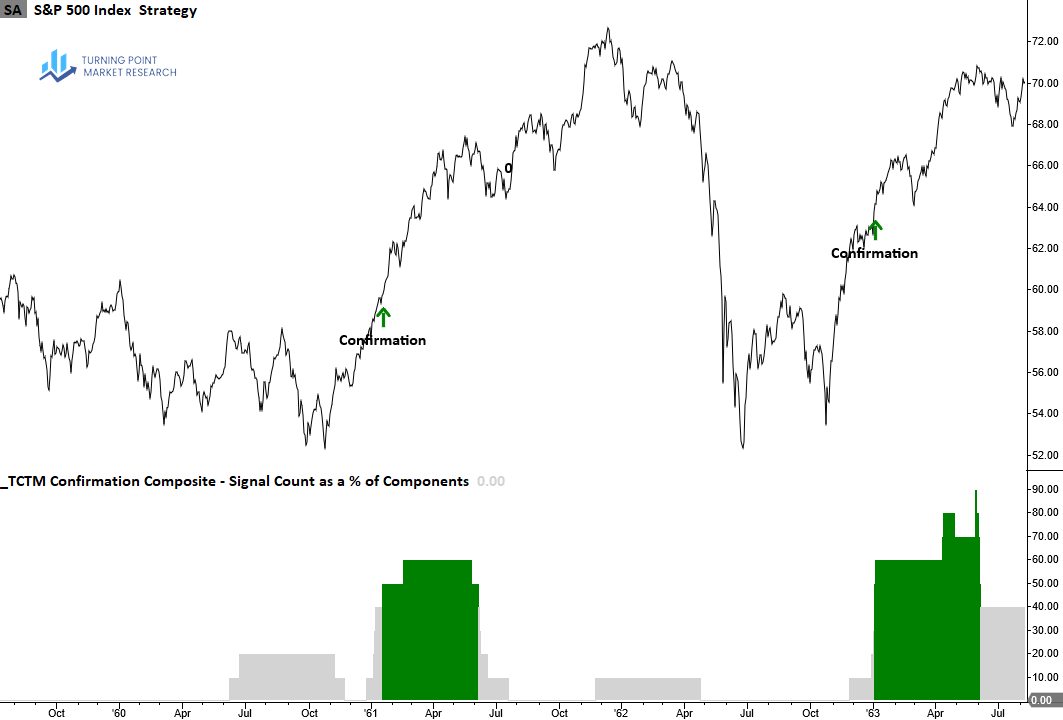
Component Signals Across Bear Markets and Corrections
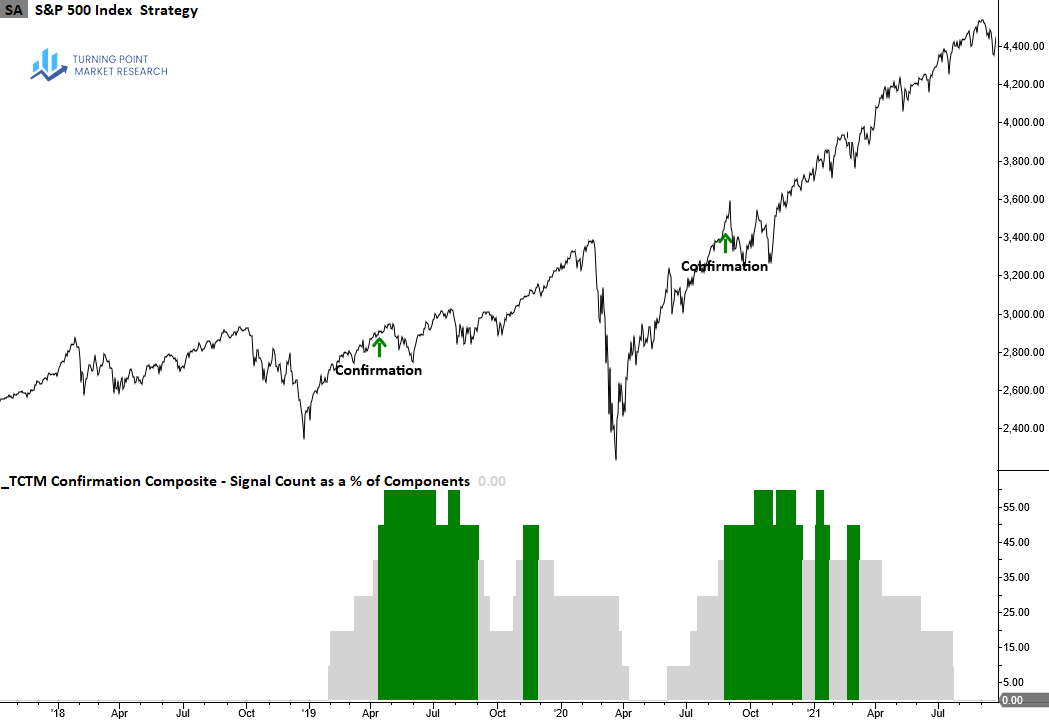
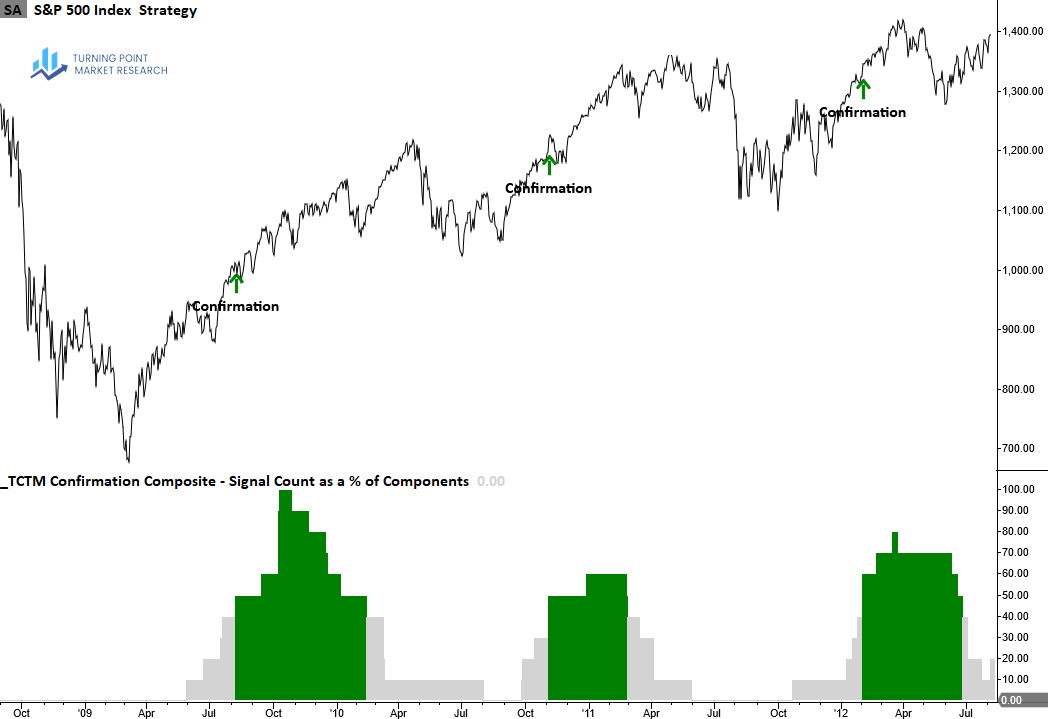
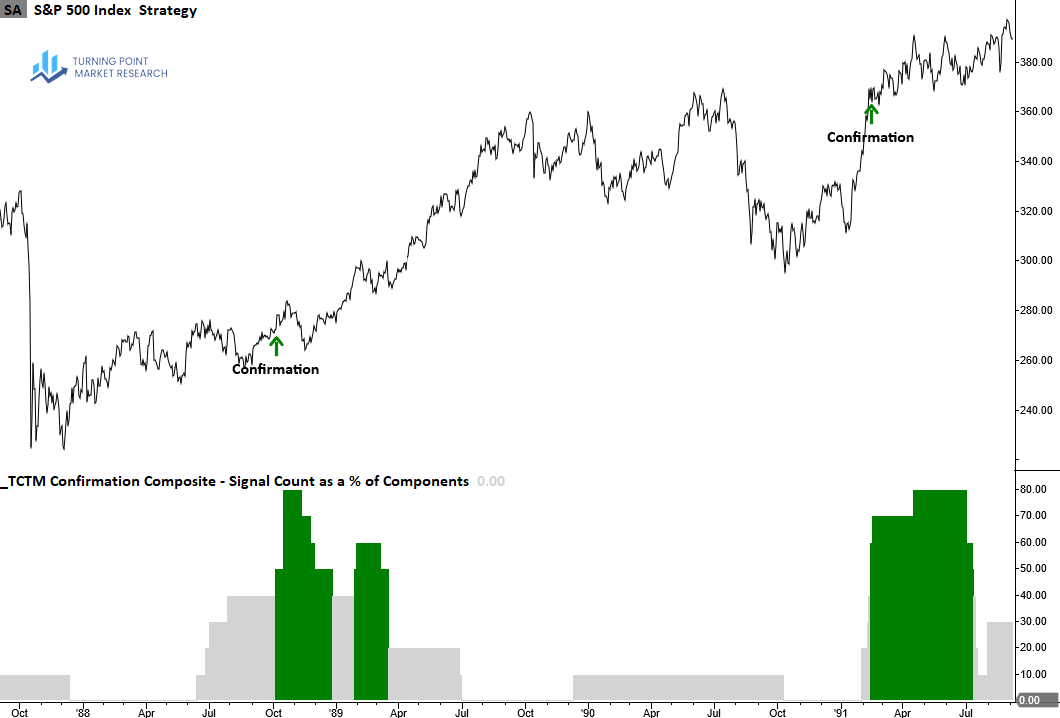
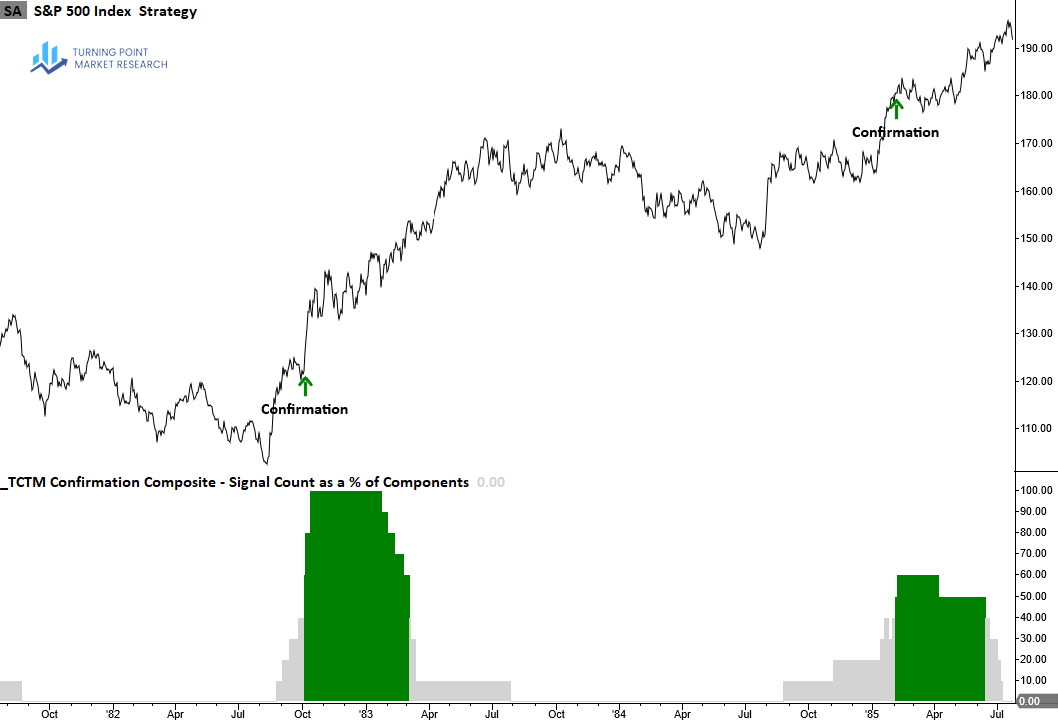
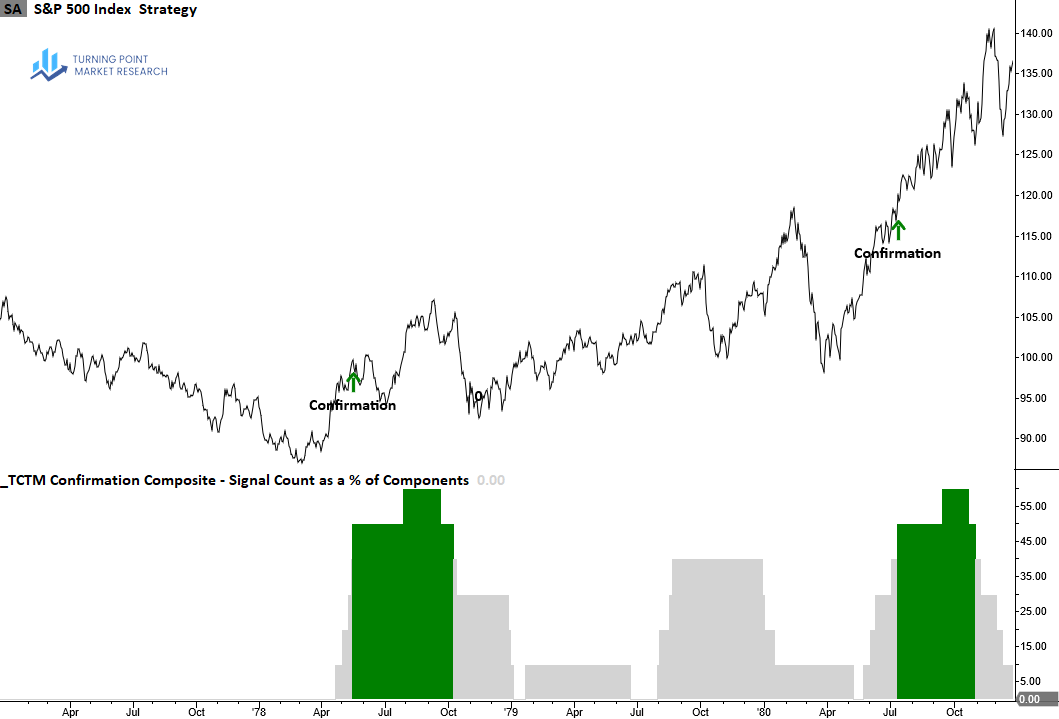
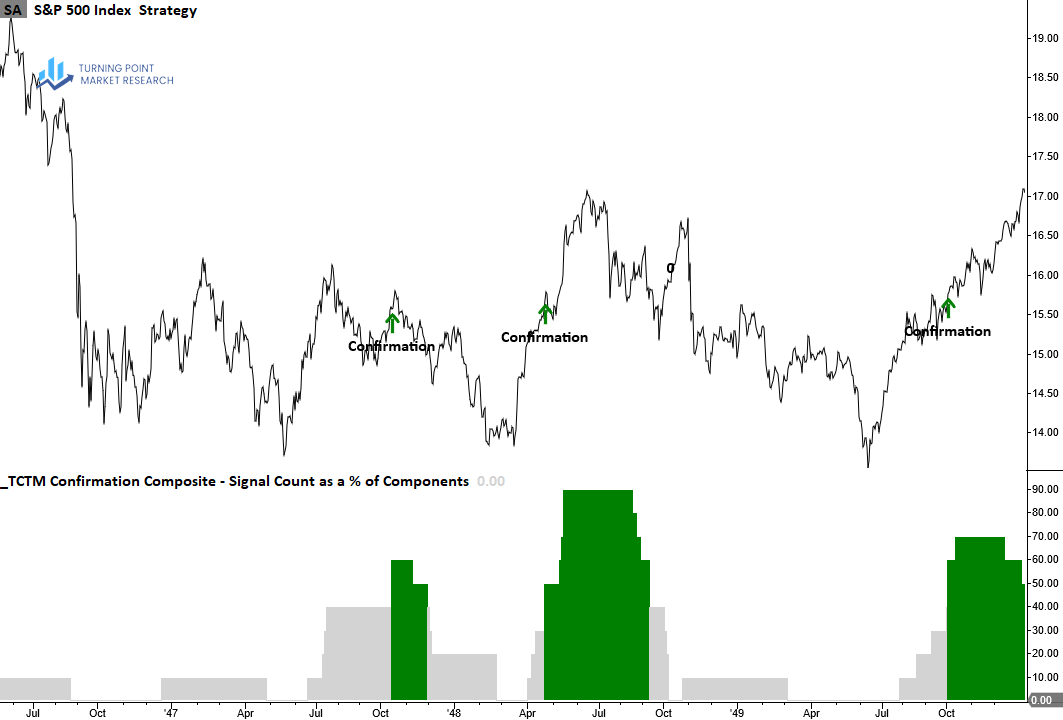
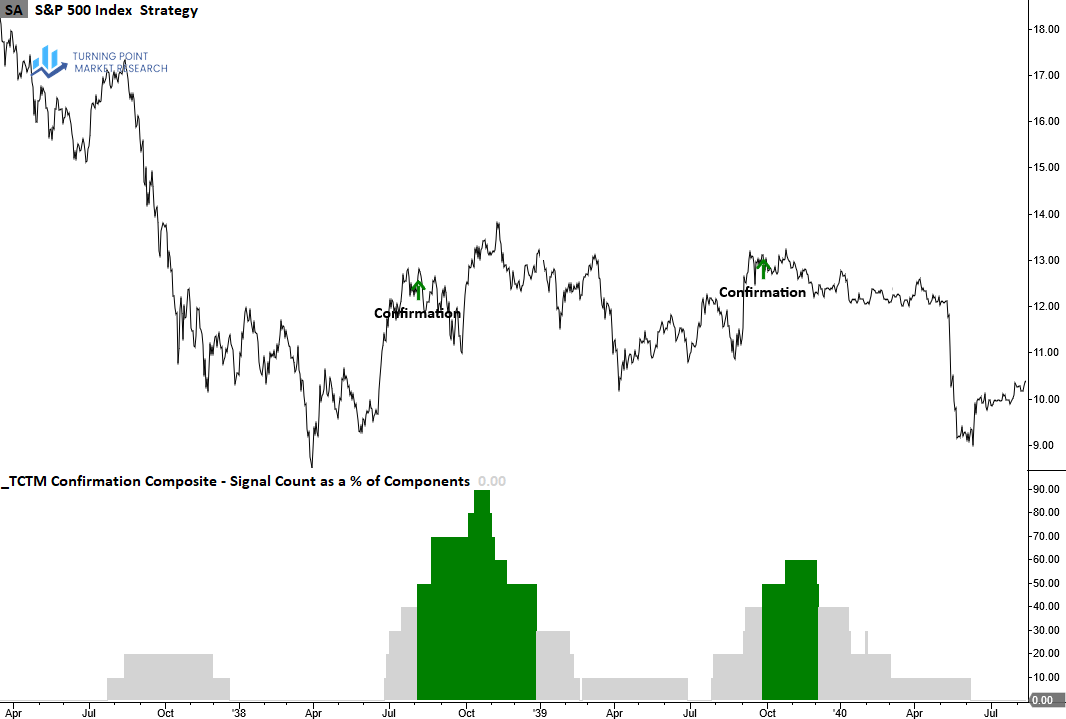
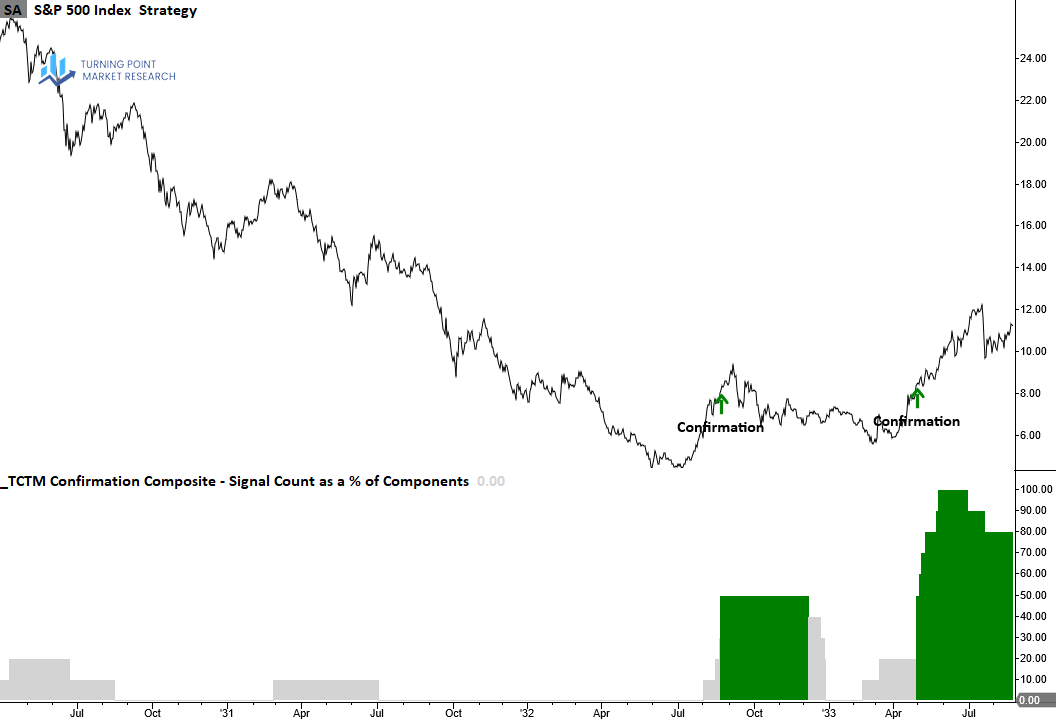
The TCTM Confirmation Composite components have demonstrated a strong, and consistent ability to identify the transition from bearish to bullish market regimes following major bear market lows in the S&P 500. Across historical episodes, an average of 87% of the composite’s members triggered confirmation alerts as the market shifted out of deeply oversold conditions and into sustained uptrends. Notably, in five separate instances, 100% of the components simultaneously signaled, underscoring the breadth and durability of these regime changes.
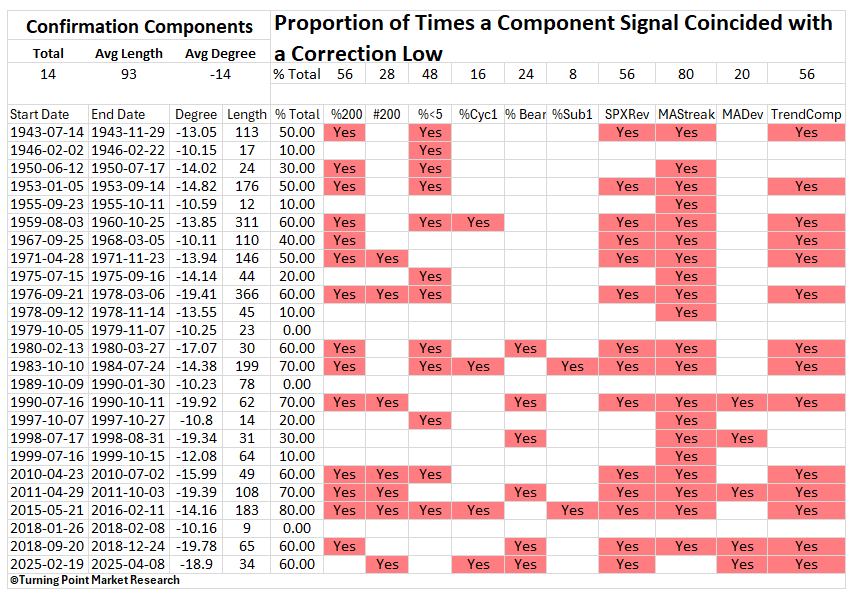
Although the number of confirmation components emerging from corrections—particularly shallow pullbacks around 10%—is not as robust as those that emerge from bear markets, the composite has done a good job of highlighting transitions out of corrections through a concentration of alerts.
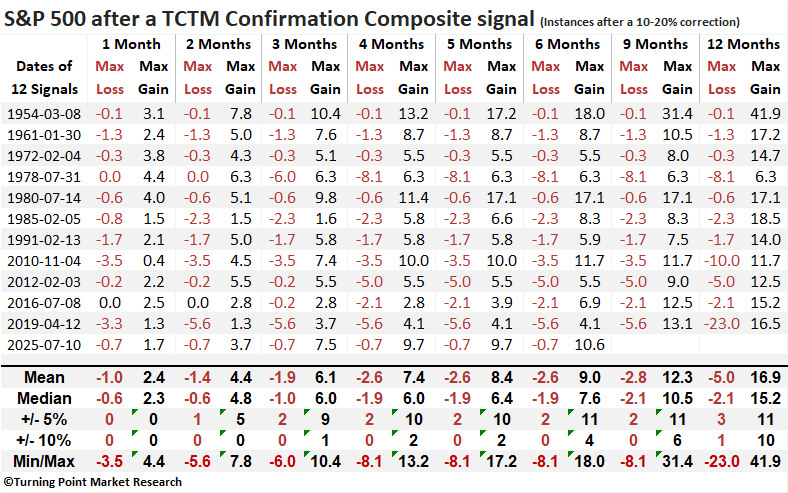
Following TCTM confirmation signals, the S&P 500 has demonstrated a strong tendency to rally over the subsequent year. The six-month horizon exhibits the highest win rate and is currently on a 25-signal winning streak, with the most recent loss occurring in 1947. Additionally, five of eight measured intervals show statistical significance relative to the full study period.
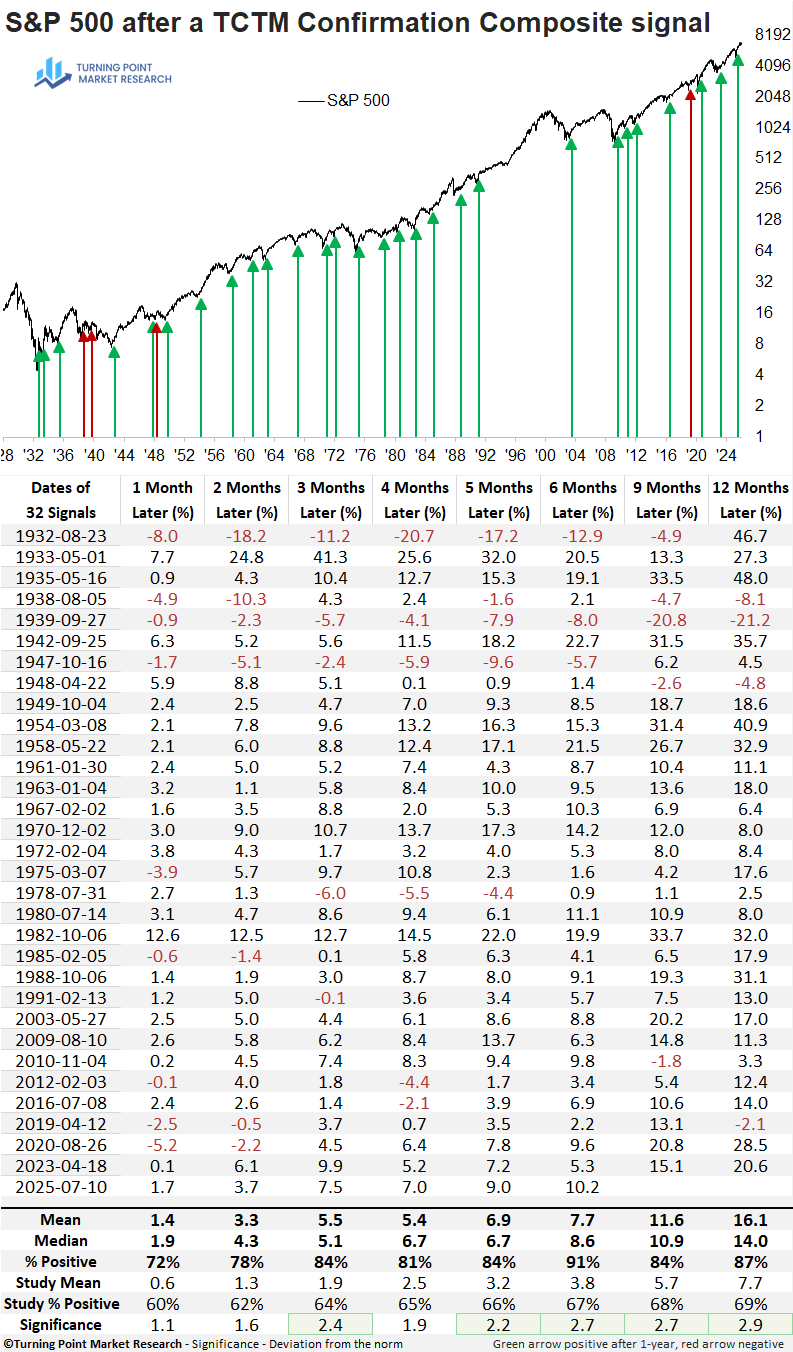
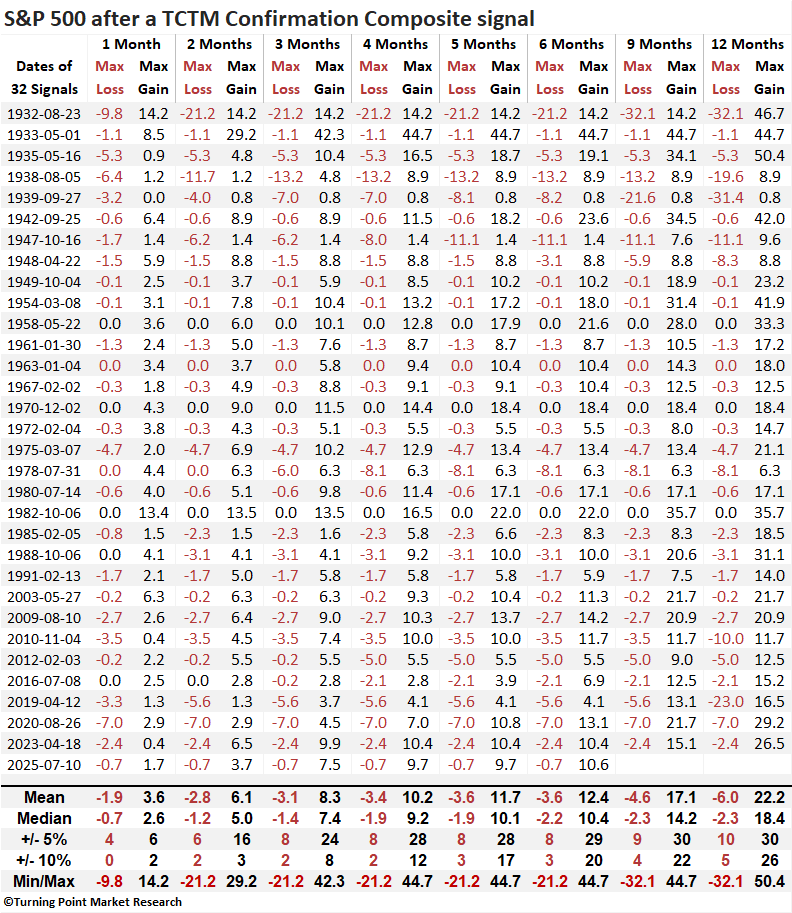
Over the favorable six-month window, the S&P 500 suffered maximum losses exceeding 10% on only three occasions, all of which occurred prior to 1948. By contrast, the benchmark advanced by 10% or more in 20 separate instances.
TCTM confirmation signals that occurred within the context of corrections exhibited outstanding returns and win rates, with the six-month interval showing gains in every case.
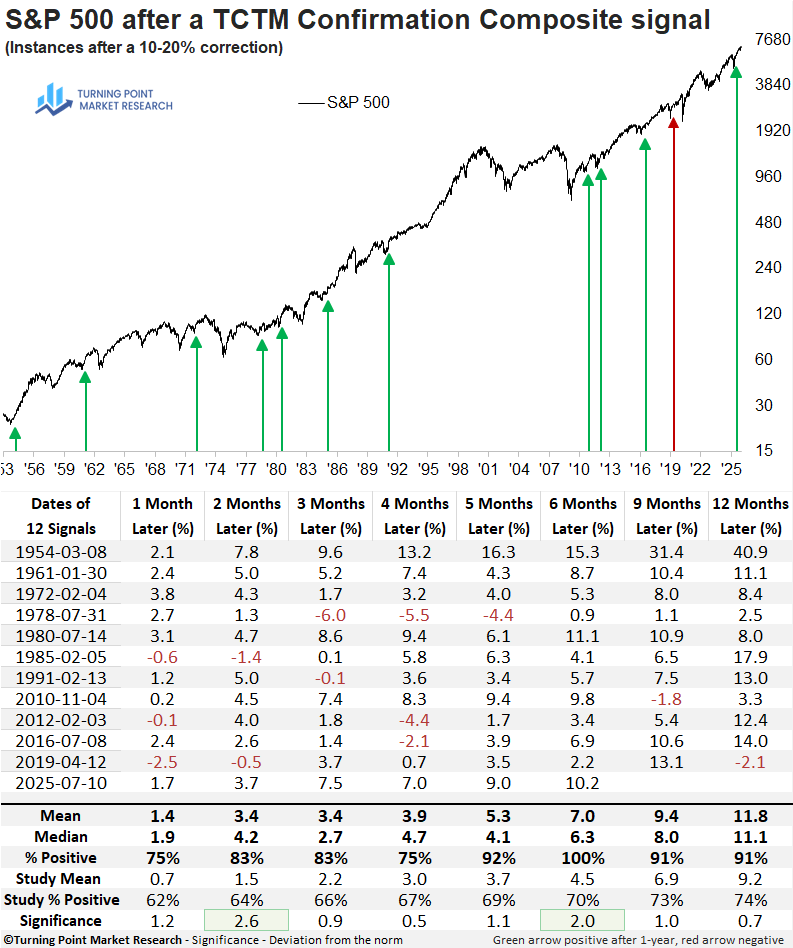
Over the next year, the S&P 500 suffered only one maximum loss exceeding 10%, while rallying by that amount or more on 10 occasions.