
Tactical Composite Trend Model – Thrust Composite
The Thrust Composite captures robust upside participation, also known as a breadth thrust. These signals often mark the end of drawdown phases and the start of significant advances.
Composite Construction and Signals
The composite integrates eleven independent inputs derived from market breadth indicators. Components are based on S&P 500 constituents and NYSE exchange members.
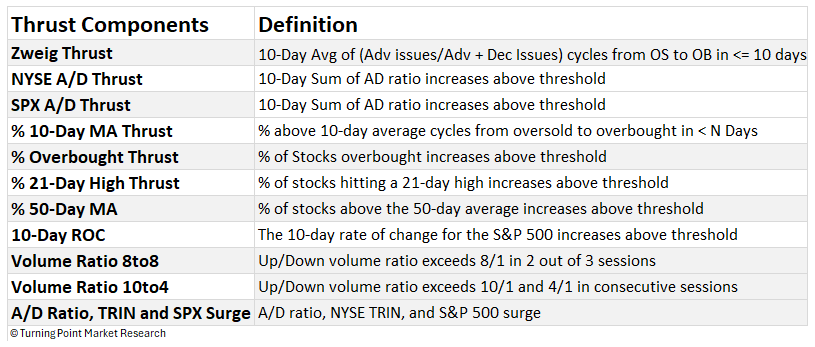
How it works
Using a voting system, the composite tallies the number of components that have generated an alert over a 50-day rolling window. A signal is generated once five or more components, representing at least 45% of the total, issue alerts. In bear markets, a higher confirmation level of 54% is required.
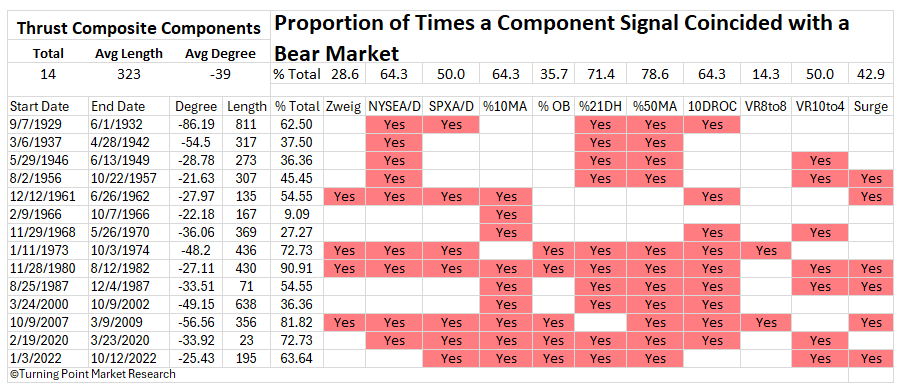
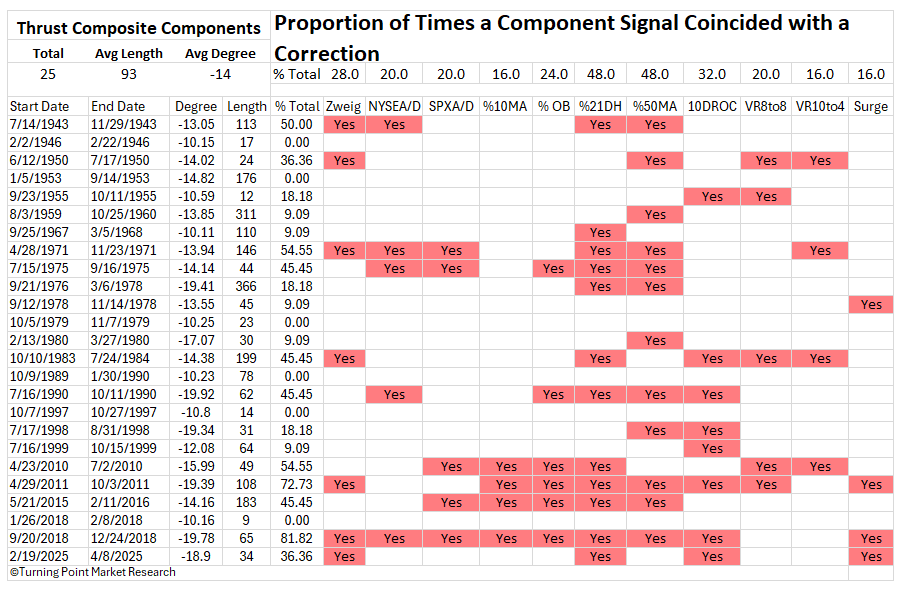
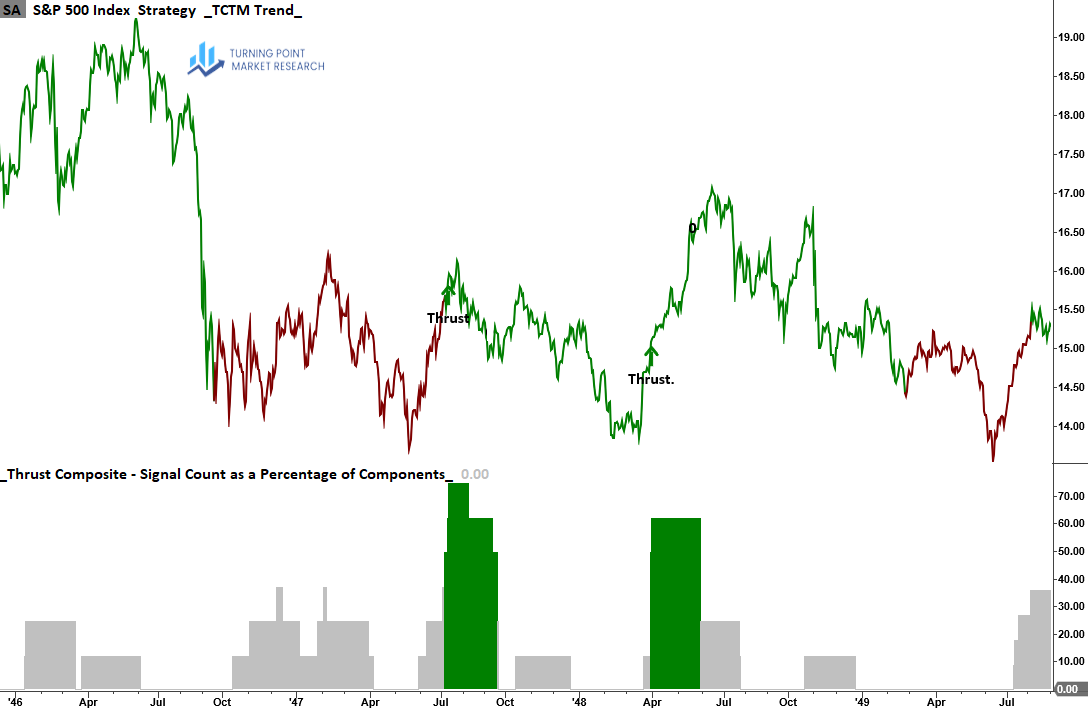
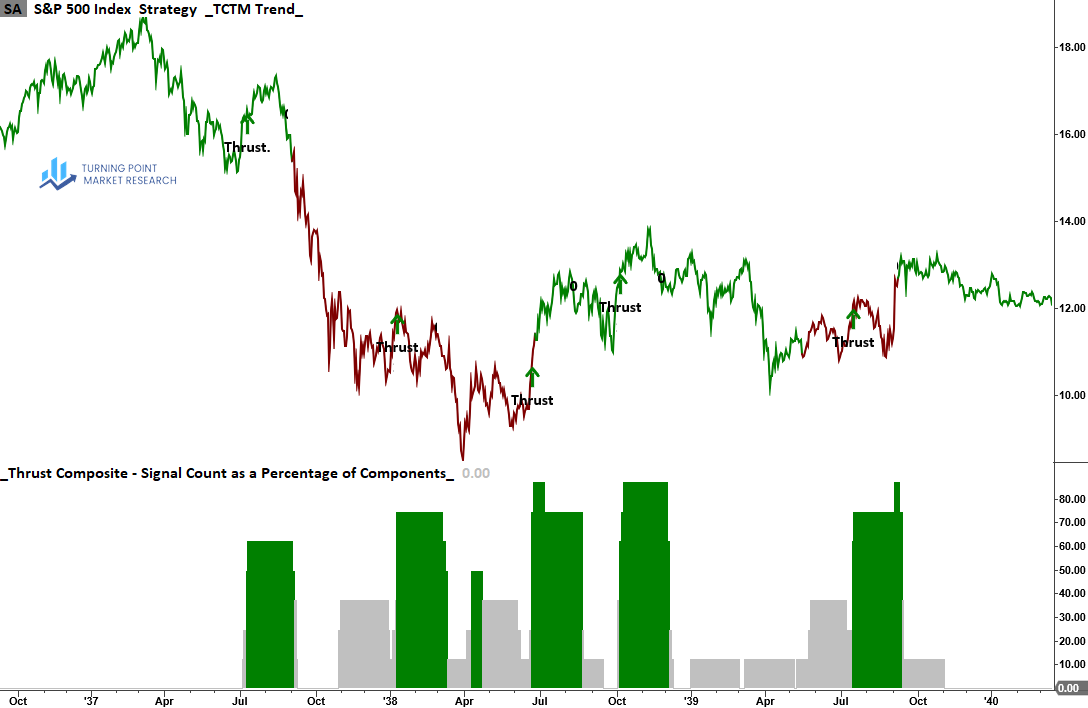
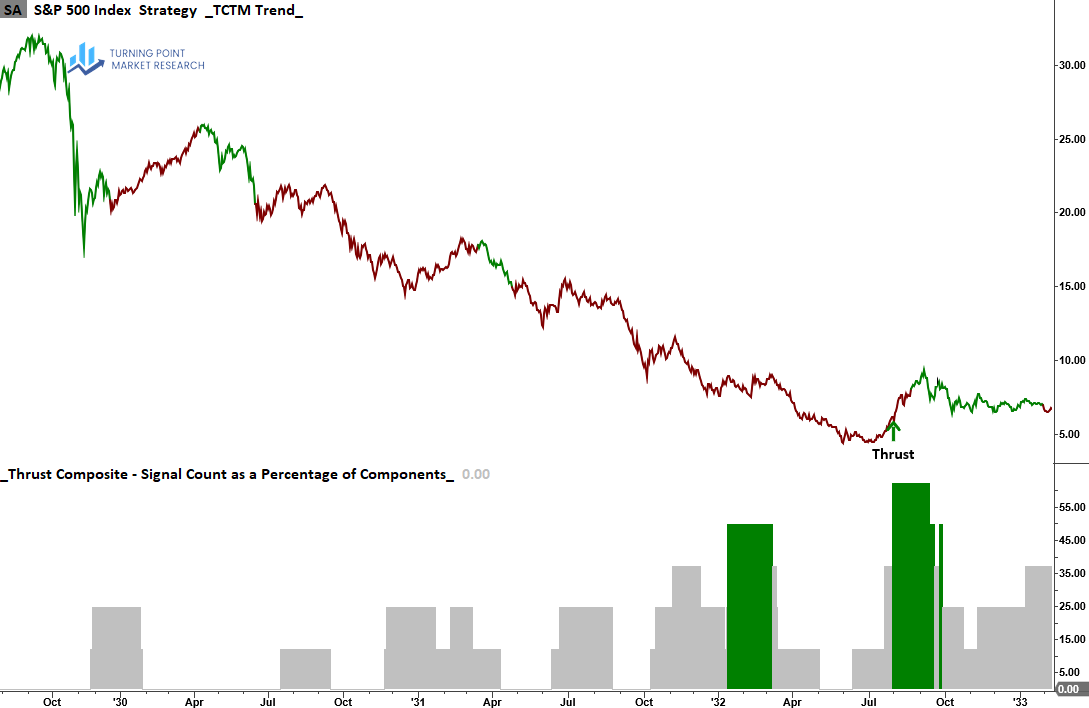
Component Signals Across Bear Markets and Corrections
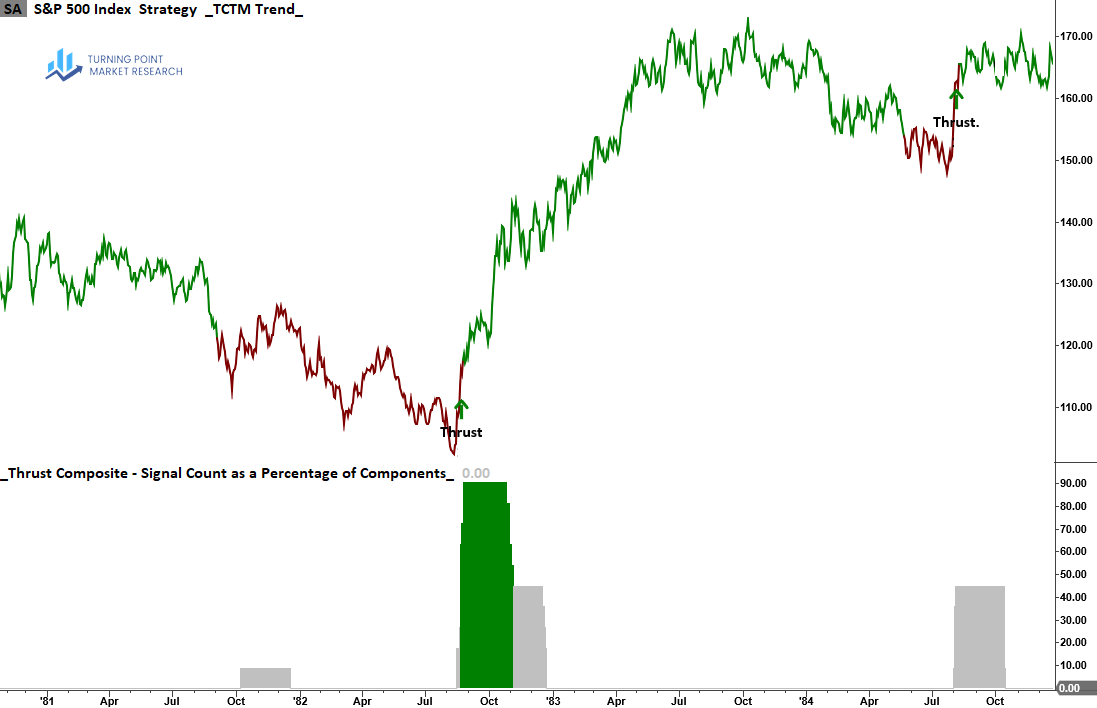
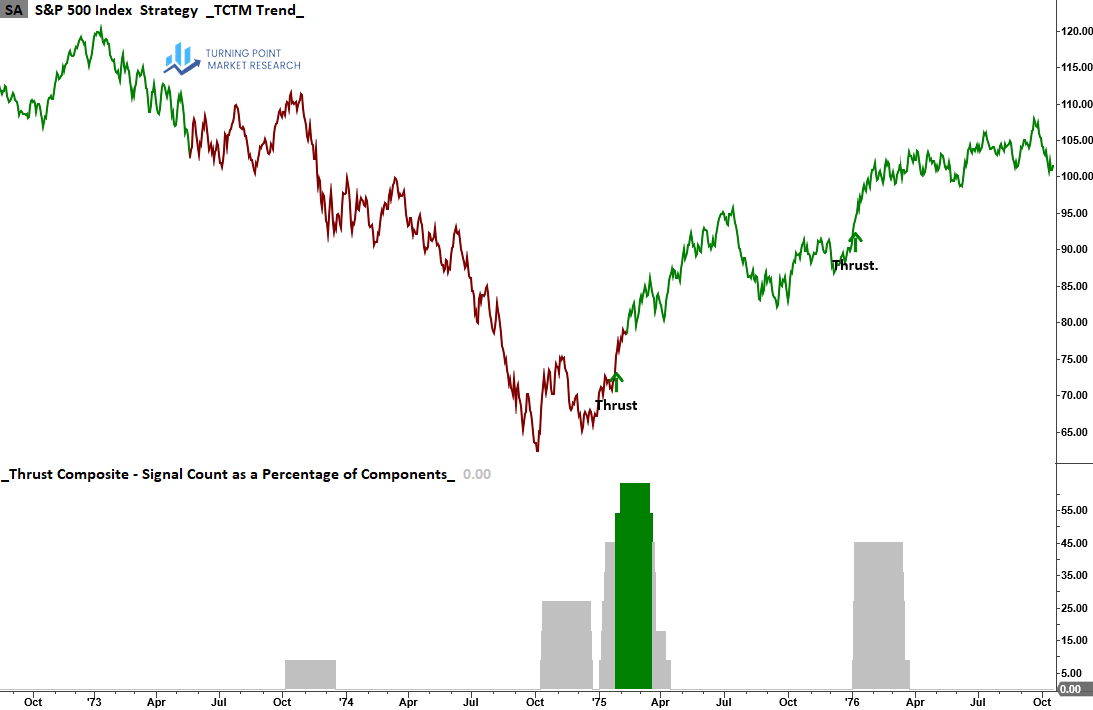
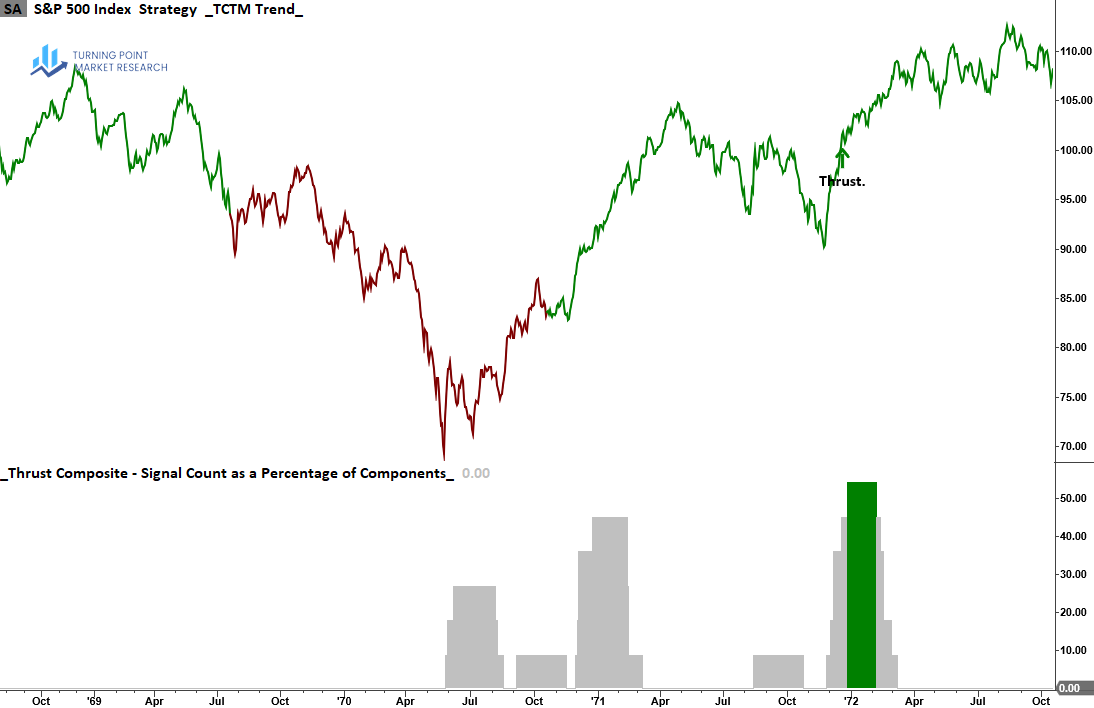
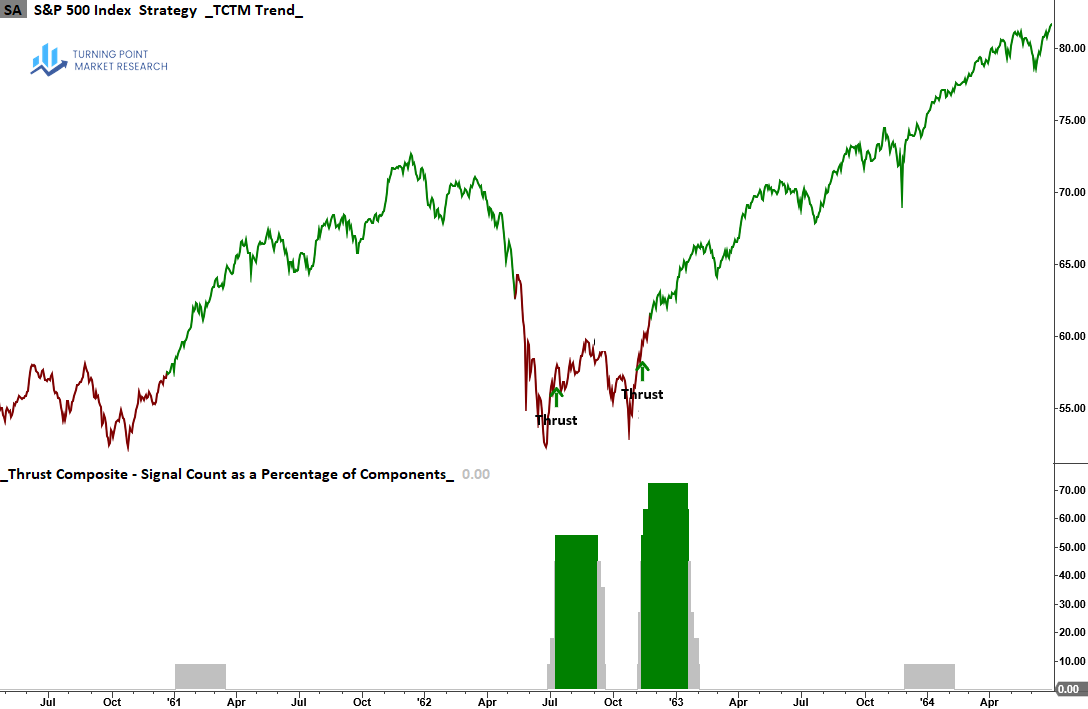
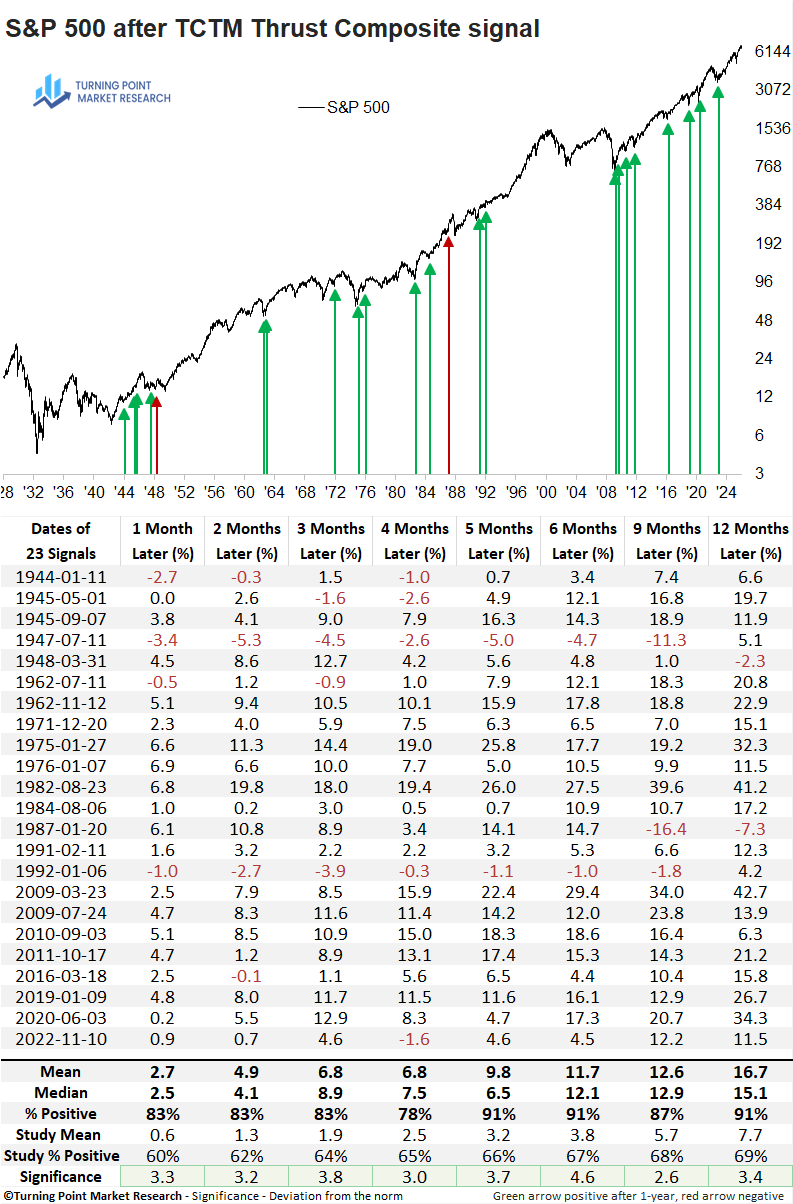
Historical Thrust Composite Signal Charts
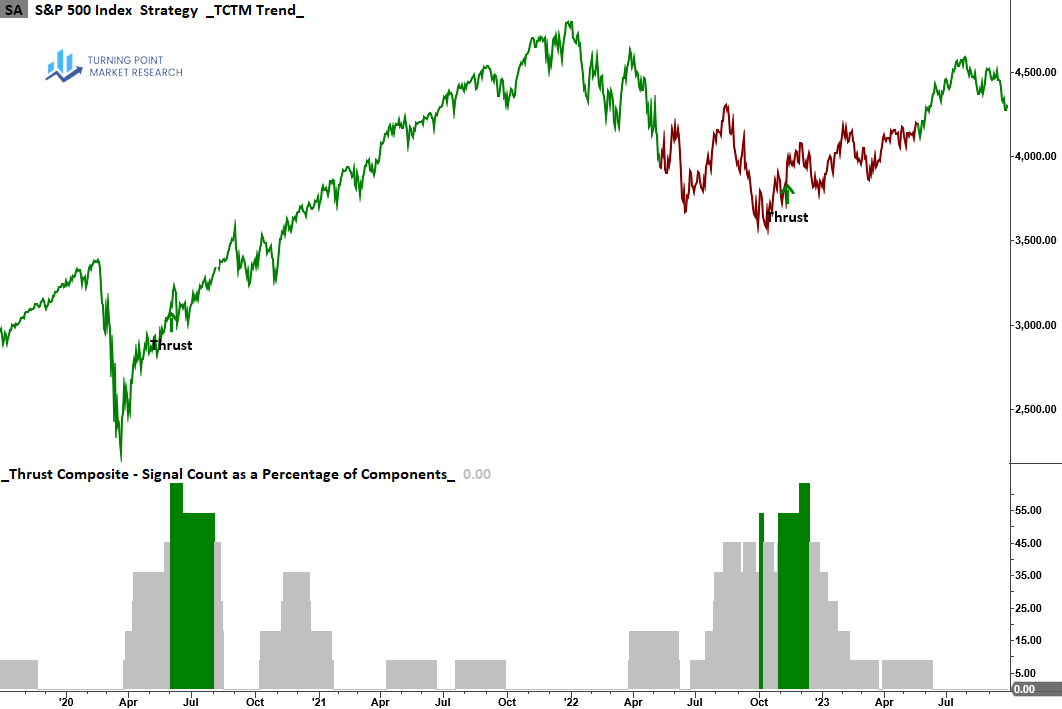
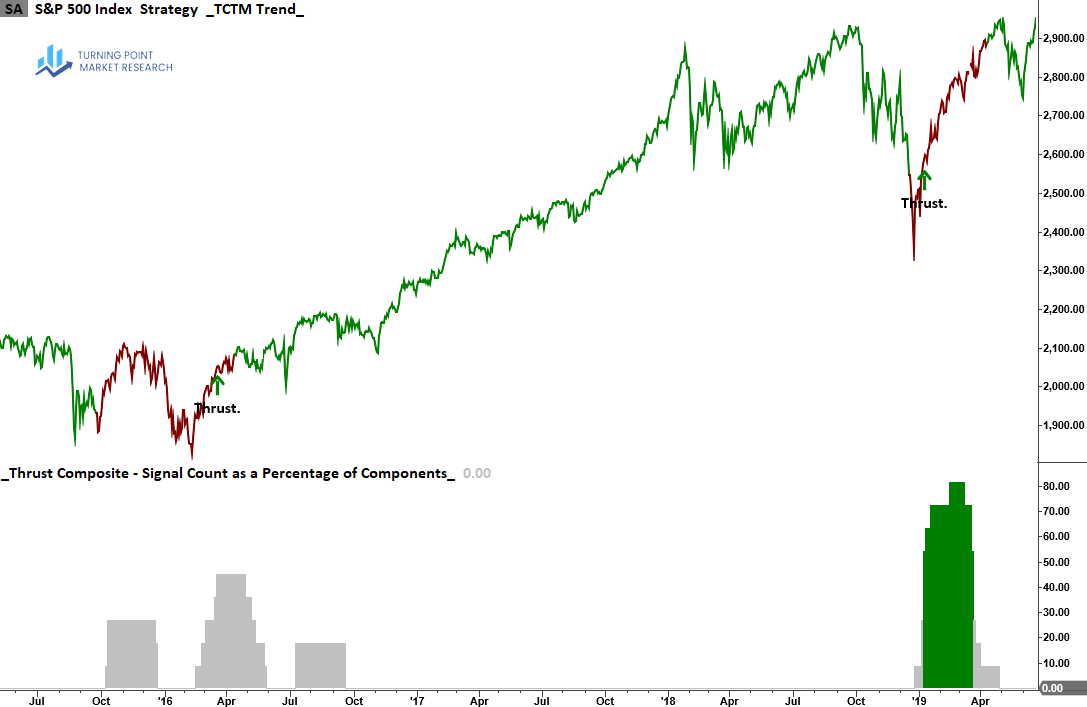
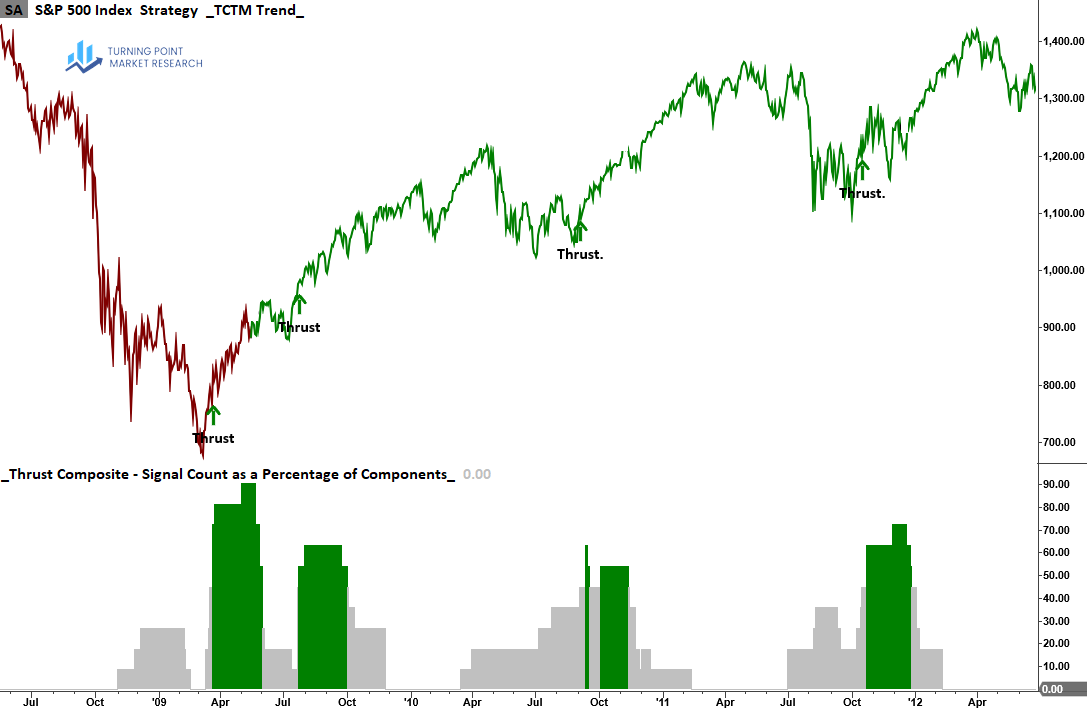
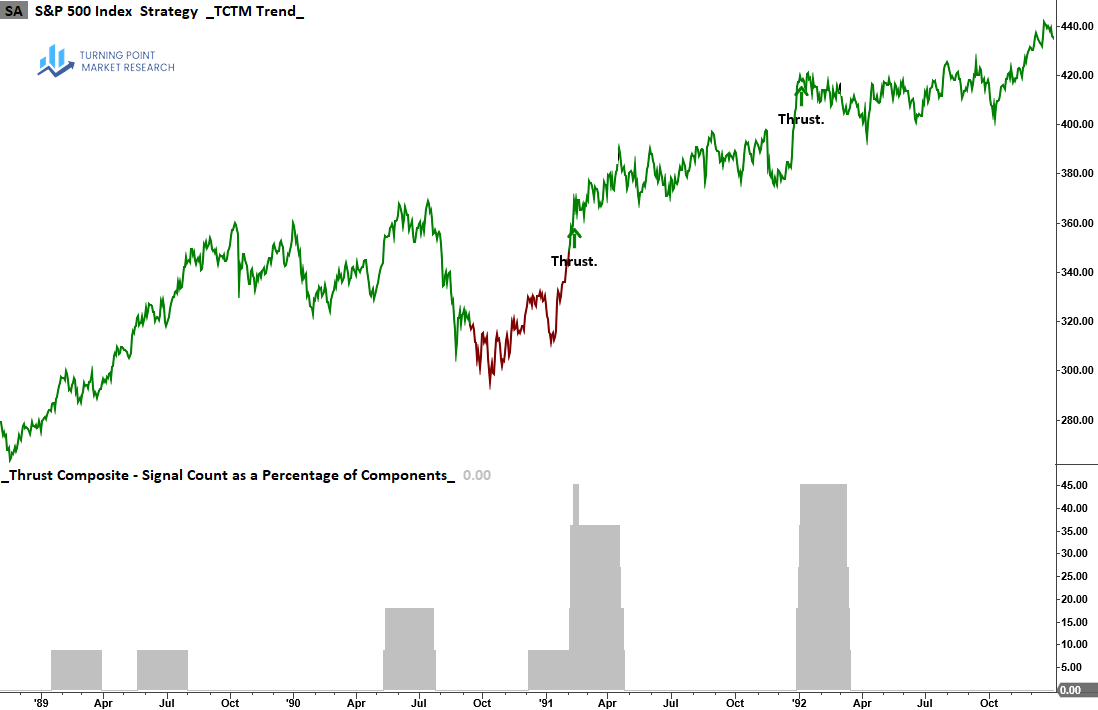
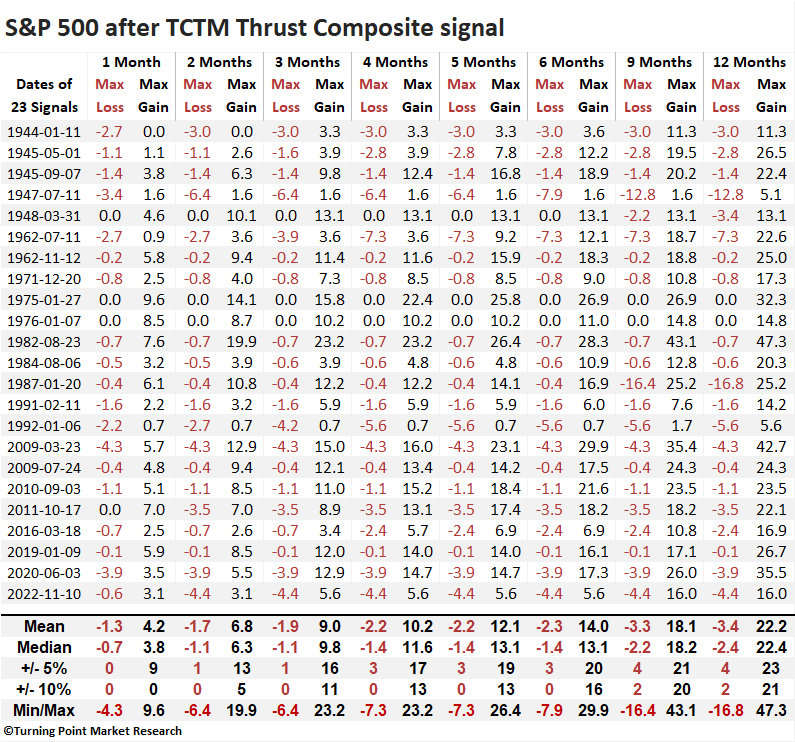
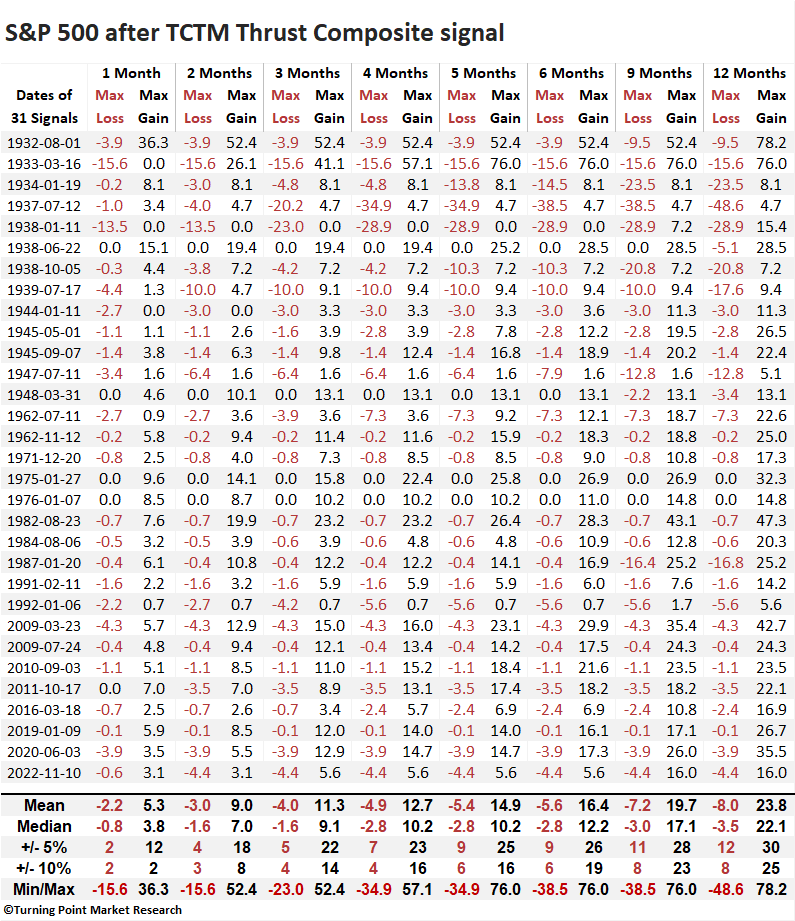
Outcome Table
TCTM Thrust signals have identified inflection points associated with sustained equity strength. Subsequent S&P 500 returns have been both strong and reliable, demonstrating meaningful statistical significance relative to random outcomes over several time frames.
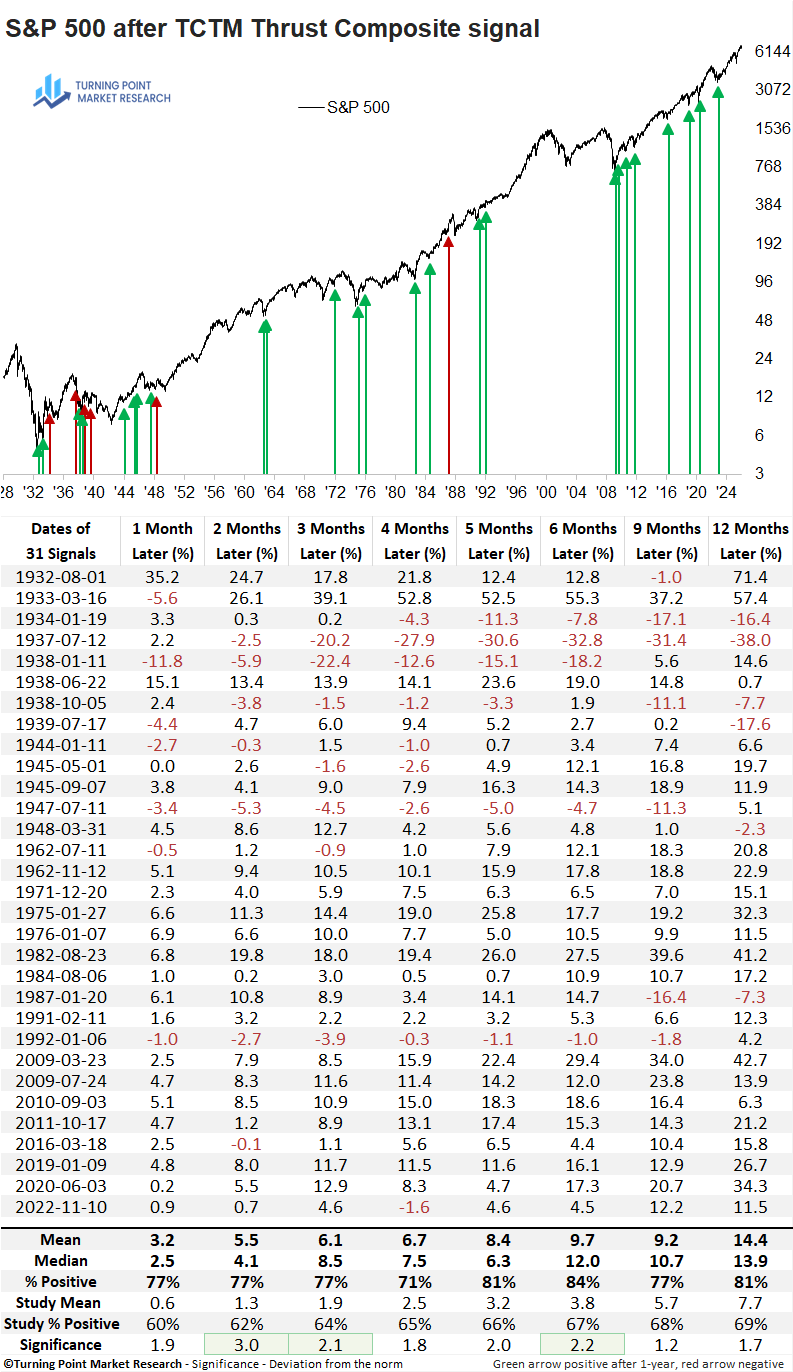
Signals post the 1929-42 period
Over the subsequent year, the S&P 500 experienced a maximum loss of 10% or more on two occasions, while climbing by that same magnitude 21 times, suggesting a favorable risk/reward profile.