
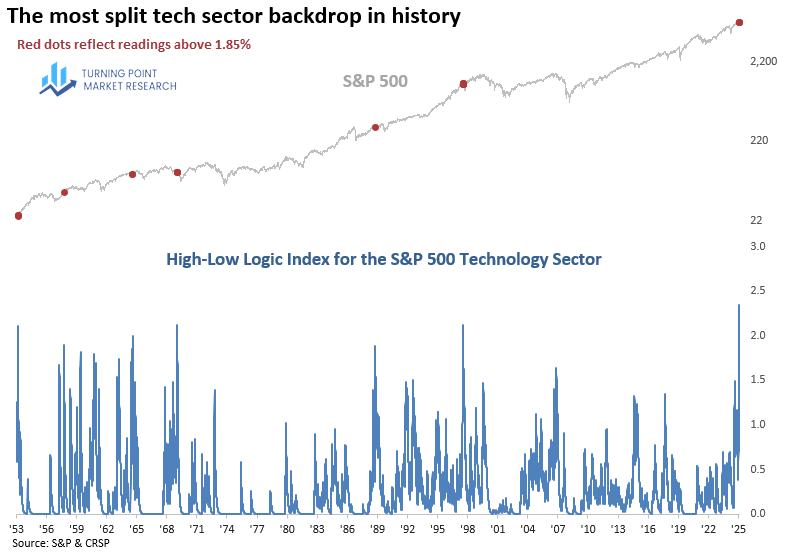
The High-Low Logic Index, developed by Norman Fosback, was designed to identify split or divergent market environments by measuring the percentage of stocks making new 52-week highs and lows over a 50-day period and plotting the lesser of the two. Fosback observed that readings above roughly 1.8% often signaled unhealthy market breadth, in which leadership and weakness coexist in an unstable manner.
Recent action within the technology sector fits this definition well, with semiconductors and storage stocks registering persistent new highs while software issues increasingly populate the new-low list. Applying the High-Low Logic framework to technology—despite its original intent to be used for NYSE data—reveals a striking result: the S&P 500 Technology High-Low Logic Index has surged to its highest level on record, marking the most extreme internal split in the sector’s history.
The last comparable reading above 1.85% occurred in July 1998, when investors were piling into select technology groups, such as semiconductors, because of their importance to internet adoption, creating a compelling parallel to today’s heavy concentration in semiconductor stocks tied to AI demand.
Each Chart of the Week highlights a theme, idea, or historic event that stood out to us. If you find it interesting, feel free to share it with friends or colleagues.
Visit www.tpmarketresearch.com to learn more about our research offering.