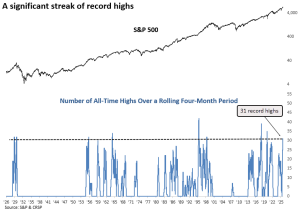

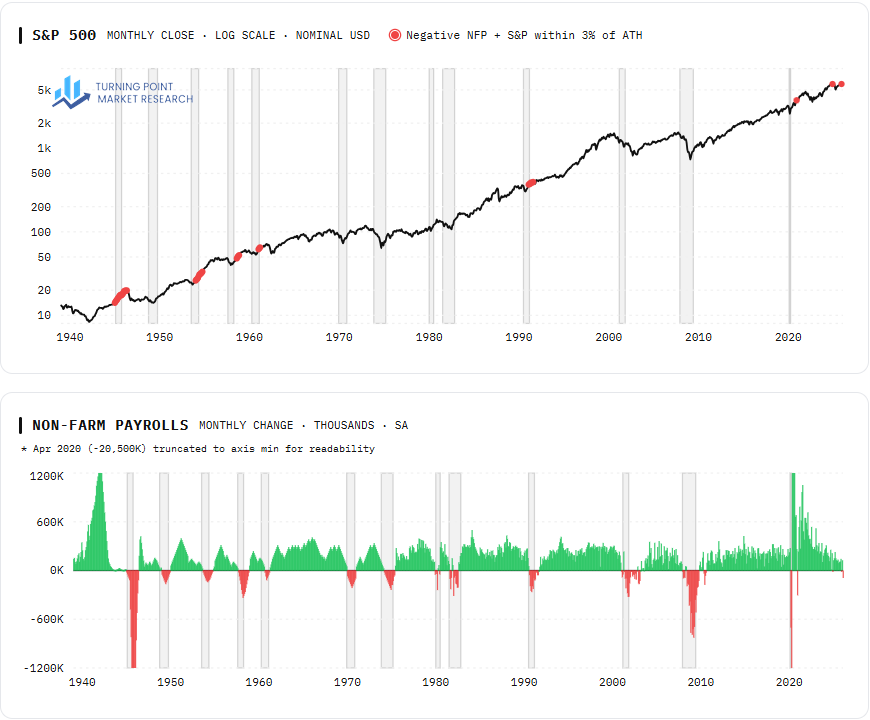
Lost in the headlines this week amid escalating tensions with Iran was a surprisingly weak employment report. According to the BLS, the U.S. lost 92,000 jobs in February, marking the fifth negative reading since June 2025 based on the data currently available—though, as always, these figures are subject to revision.
That raised an interesting question: when have we seen negative monthly job growth while the S&P 500 is trading within 3% of an all-time high? Plotting those instances on a chart of the index—highlighted with red dots and recession shading—reveals that they tend to occur shortly after recessions, reflecting lingering softness in the labor market. While we haven’t experienced a broad recession in recent years, the pattern suggests the economy may have endured a growth scare or even localized recessions across some industries.
Each Chart of the Week highlights a theme, idea, or historic event that stood out to us. If you find it interesting, feel free to share it with friends or colleagues.
Visit www.tpmarketresearch.com to learn more about our research offering.