

Turning Point Market Research is designed to help traders and investors navigate market conditions through a structured, signal-driven framework that prioritizes price action through trend analysis, momentum, relative strength, and market breadth. The service is delivered through a combination of website-based analytics and regularly published research reports.
This guide explains how to effectively use the service, which is organized into four primary research sections: the Market Overview page, the TCTM page, the Dual Trend System page, and Research Reports.
1.) Market Overview Page
Updated on the website and emailed to subscribers each evening, the market overview page provides a structured summary of our stock market outlook, key model readings, and leadership insights.
The House View
The House View represents our current outlook on the stock market — either bullish or bearish, and short- or long-term.
The primary basis for our outlook lies in our Tactical Composite Trend Model and its underlying signals. Composite alerts influence the short-term view, whereas the TCTM’s Long-Term Trend stance anchors the long-term outlook. Secondary confirmation comes from the S&P 500 Risk On/Off and Trend Systems.

How to use it:
- Treat this as the headline summary of our outlook.
- Align your exposure and positioning with the directional bias (bullish or bearish) and the indicated timeframe.
- Note that the House View can shift when the Tactical Composite changes, signaling a critical turning point. When this occurs, a comprehensive research report will be delivered to subscribers, including all supporting details.
Tactical Composite Trend Model Components
This section lists the individual model components that make up the Tactical Composite Trend Model, including their signal direction (bullish, bearish, or neutral) and signal count. Signal directions remain in place until the composite count resets to zero. The Long-Term Trend Model remains in either a bullish or bearish condition.

How to use it:
- Watch for new signals across the various models — most components utilize a signal count threshold of 50%.
- The TCTM follows a structured sequence: Risk-Off, Capitulation or Bottom, then a Thrust signal, and ultimately followed by a Confirmation alert.
- Use this section to understand the signals supporting the House View.
Chart Example

S&P 500 Risk-On / Risk-Off and Trend Systems
This section includes both short-term and long-term Risk-On/Off Composites and a Trend System for the S&P 500. The risk-on/off models combine trend and market breadth data, whereas the Trend System is based purely on trend. Collectively, these three models indicate whether market conditions are risk-on (favorable) or risk-off (defensive).

How to use it:
- Traders can use the short-term composite as a broad-market overlay to align their trading strategies with risk-on or risk-off environments. Investors can use it to time market exposure around significant turning points.
- Traders and investors can use the long-term composite as a market barometer to understand the big-picture backdrop.
- Investors and traders can use the Trend System as an additional indication of the prevailing S&P 500 market trend.
- Collectively, these models can be used to increase or decrease market exposure in a stair-step process following a TCTM composite signal. For instance, if a TCTM Risk-Off signal is triggered and one raises cash, a subsequent bearish signal from the Trend System could serve as confirmation to increase cash positions further.
Chart Examples
Short-Term Risk-On/Off

Long-Term Risk-On/Off

Trend System

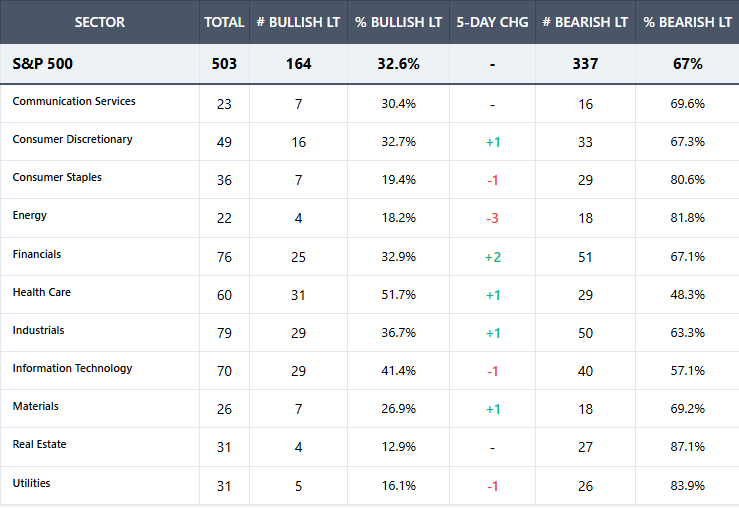
Sector Analysis
The Sector Analysis section includes five systems, three of which mirror those used for the S&P 500 index. The remaining two are the Short- and Long-Term Dual Trend Systems, which combine trend and relative strength to identify sector leadership.

How to use it:
- Traders should focus on the short-term dual trend system for tactical or swing trading ideas and the other systems for additional confirmation.
- Investors should focus on the long-term dual trend system for portfolio allocations, with input from other systems for additional confirmation.
- The sector section collectively highlights leadership trends, helping identify whether the market favors growth, value, commodity-oriented, or defensive groups.
- In bullish environments, we should see cyclical sectors like communications services, consumer discretionary, financials, industrials, and technology display bullish conditions. Conversely, in unfavorable backdrops, like bear markets, most, if not all, systems will display a bearish status.
Putting It All Together
Each section of the Market Overview is interconnected:
- The House View provides our outlook, based on the Tactical Composite Trend Model and supporting systems.
- The Risk-On/Off and Trend systems add context to the overall market environment.
- The Sector Analysis reveals where leadership resides, helping guide tactical and strategic allocation decisions.
By following these components in sequence each evening, users can gain a complete, structured understanding of market conditions — from the broad outlook down to sector-specific opportunities.
2. Tactical Composite Trend Model (TCTM)
The Tactical Composite Trend Model serves as the cornerstone for the service and provides its insights through two complementary resources: the Live Page and the Historical Guides.
A. TCTM Live Page
Purpose and Role
Subscribers can monitor developments as they unfold on the TCTM Live Page, which provides the model’s most current readings.
Update Frequency
- Updated when new signals occur
- At a minimum, refreshed weekly
What You’ll Find
- Signal Counts: The number of active buy or sell signals across the model’s components.
- Charts: Visual representations of the model’s signal counts and alerts.
- Commentary: Brief interpretive thoughts explaining recent changes.
How to Use It
- Monitor changes in signal counts to assess market regime shifts.
- Use charts to contextualize current signals relative to prior market cycles.
B. TCTM Historical Guides
Purpose and Role
The Historical Guides provide depth and transparency into the construction and long-term behavior of the Tactical Composite Trend Model.
What You’ll Find
- Model Construction: Detailed explanations of components, weighting, and signal thresholds.
- Historical Charts: Long-term visualizations spanning nearly a century of market data.
- Outcome Tables: Historical performance statistics following various signal conditions.
How to Use It
- Understand why the model behaves as it does in different environments.
- Evaluate the historical reliability and limitations of signals.
3. Dual Trend System Page
Dual Trend System Process
The Dual Trend System (LT) is a proprietary model designed to identify securities that are in established uptrends and exhibiting leadership. It leverages two core pillars: trend-following and relative strength.
Coverage Includes
- S&P 500
- S&P 400
- S&P 600
- Cyclical Stocks
- Thematic Stocks
- Gold & Silver Miners
- ETFs
Page Structure and Features
A. Summary Roll-Up Section
- Aggregates dual trend signals by sector.
- Designed for easy identification of leadership trends.
B. Individual Security Data Section
- Displays data for individual stocks or ETFs.
- Sortable Columns: Allows users to sort each indicator to identify trends
- Search and Filter Functionality: Includes a search box that allows users to quickly find specific stocks or ETFs, or filter and sort the universe by sector or sub-industry group.
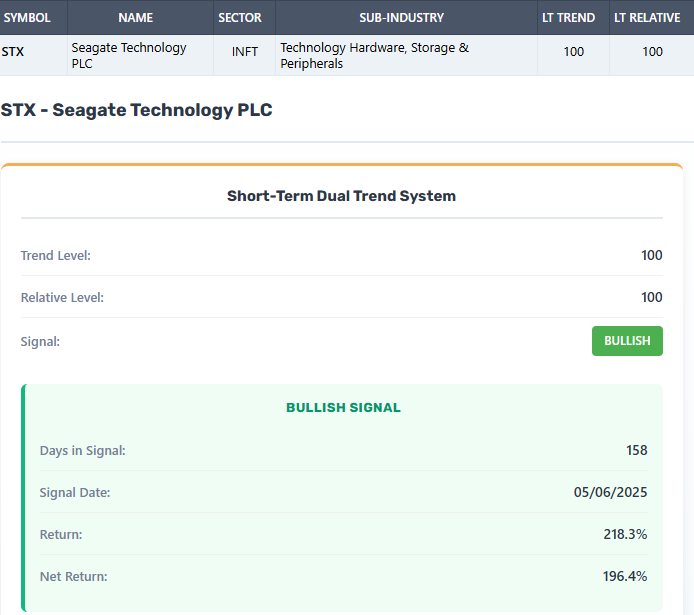
- Pop-Up Detail Boxes: Provide additional contextual data without leaving the page.
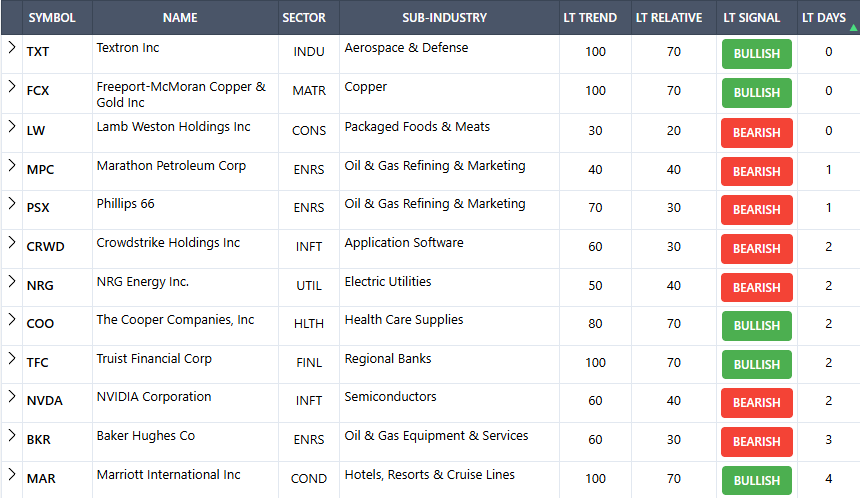
How to Use It
- Start with the summary section to identify sector-level trends.
- Drill down into individual securities for further analysis.
Dual Trend System Process
Phase 1: Initiation (Short-Term Dual Trend Signals)
- As stocks emerge from a market correction, traders or investors should monitor the short-term Dual Trend System as it provides more timely entry points for emerging trends.
- If a stock fails to maintain its short-term buy signal, it is sold, and focus shifts to the next opportunity.
Phase 2: Transition (Confirmation by Long-Term Dual Trend Signals)
- As the uptrend progresses, stocks that continue to exhibit improving leadership trends typically transition to a long-term Dual Trend buy signal.
- In this scenario, investors should adhere to the long-term dual trend rules to minimize the effects of short-term volatility and position for sustained gains.
Phase 3: Established Uptrend (Hold or Trade)
- Investor Path: Investors should maintain an allocation to stocks as long as the long-term Dual Trend model remains on a buy signal.
- Trader Path: Traders can utilize the short-term system to trade pullbacks within the context of a bullish long-term trend signal.
Phase 4: Risk Management (TCTM Risk-Off Alert)
- When the TCTM Risk-Off composite issues a warning, it signals a potential market drawdown or elevated risk environment.
- In this case, investors and traders should shift to the short-term Dual Trend system’s exit criteria, enabling timely profit-taking and risk mitigation.
Flow Summary:
Initiation → Transition → Established Uptrend (Investor Hold / Trader Swings) → Risk Management (Short-Term Exit)
By combining these two timeframes, the Dual Trend System adapts to different market conditions and objectives, enabling investors to stay with leading stocks through durable uptrends while providing traders with a structure to capture repeatable swing opportunities.
Chart Examples
Short-Term Dual Trend System

Long-Term Dual Trend System

4. Research Reports
While the Market Overview provides a snapshot of our models, our Research Reports deliver comprehensive details on the signals driving our outlook, along with context and insights drawn from our 30 years of market research.
- Reports are primarily based on Tactical Composite Trend Model (TCTM) signals but also include insights from other models and sector- and industry-level leadership trends.
- Occasionally, we publish reports on big-picture trends in other assets when signals occur.
- Typically, we publish 1–3 reports per week, depending entirely on signal output. If no reports appear for a few days, it means there is nothing insightful to share.
How to use it:
- Use these reports to gain a better understanding of future expectations for indexes, stocks, or other asset classes.
- While the Market Overview shows “what the models are saying now,” the reports explain the details behind a signal.
Outcome Table and Definitions
The outcome table summarizes the performance of trading signals using key statistics, including the mean and median returns, the percentage of positive outcomes (win rate), and significance. The significance measure indicates how the returns from the trading signals compare to the average return over the whole study period—readings above +2 or below –2 suggest statistically significant outperformance or underperformance, respectively. The analysis also includes the mean return and percentage of positive returns for the study period (from the first signal date to the last), allowing direct comparison with the signal’s results.

The secondary outcome table provides key summary statistics, such as the mean and median maximum gains and losses, offering valuable context for historical performance following similar signals. It also tracks how often a signal leads to gains or losses of 5% or 10% or more, providing a clear view of upside potential versus downside risk. Together, these metrics help quantify the risk/reward profile of a setup — and in particular, the maximum loss figure can serve as a practical guide for setting a stop level just below the market when acting on a buy signal.

Signal Performance Metrics
Time Frames – Returns are measured over multiple horizons, ranging from 1 to 8 weeks and 1 to 12 months, to gauge how signals unfold in the short and long term.
Median – The midpoint of all forward returns, showing a typical outcome with less impact from outliers.
Mean – The simple average of forward returns, which can be skewed by substantial gains or losses.
Win Rate – The percentage of signals with positive returns over a given time horizon.
Study Period Mean – The average return across all days in the study period, providing a baseline for comparison with signal returns.
Study Period Win Rate – The percentage of days with positive returns over the study period, serving as a benchmark against signal win rates.
Significance – A way to show how far a return deviates from normal, factoring in volatility and sample size. The further away from zero, the more significant.
Mean Max Gain – The average of the highest gains reached at any point during the time horizon across all trades or signals.
Median Max Gain – The midpoint of the highest gains reached at any point during the time horizon, where half of the trades or signals exceeded this value and half did not.
Mean Max Loss – The average of the largest losses experienced by a trading signal at any point during the time horizon across all instances.
Median Max Loss – The midpoint of the largest losses experienced by a trading signal at any point during the time horizon, where half of the losses were larger and half were smaller.
+/-5% – The number of times a trading signal’s return increased or decreased by more than 5% over the signal horizon.
+/-10% – The number of times a trading signal’s return increased or decreased by more than 10% over the signal horizon.
Maximum Gain – The highest return achieved by a trading signal at any point during the time horizon.
Maximum Loss – The most significant decline (negative return) experienced by a trading signal at any point during the time horizon.
Best Practices
To make the most of Turning Point Market Research, follow this structured approach:
Daily Routine
- Start with the Market Overview Page or Email — review the House View to see if our data-driven framework is bullish or bearish.
- Check the TCTM Composite Components — note any changes in direction or if the signal count approaches 40%, indicating that several components have triggered an alert and that a broad composite signal could be imminent.
- Review the Risk-On/Off and Trend Systems — Examine them to determine whether they confirm a bullish or bearish stance.
- Scan the Sector Analysis — Review which sectors are leading and note whether the configuration is pro-cyclical, typically seen in market uptrends, or defensive, commonly associated with unfavorable environments.
- Check the Tactical Composite Trend Model (TCTM) Live Page – Visit the live TCTM page for the latest updates and commentary, paying close attention to trend alignment and confirmation.
- Review the Dual Trend Page – Analyze the Dual Trend framework to identify emerging or evolving leadership trends across markets.
- Assess Research Reports – Review newly published research reports, as they often provide deeper context, historical perspective, and detailed analysis surrounding new or developing signals.