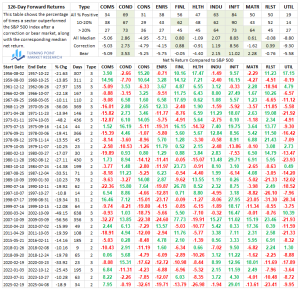

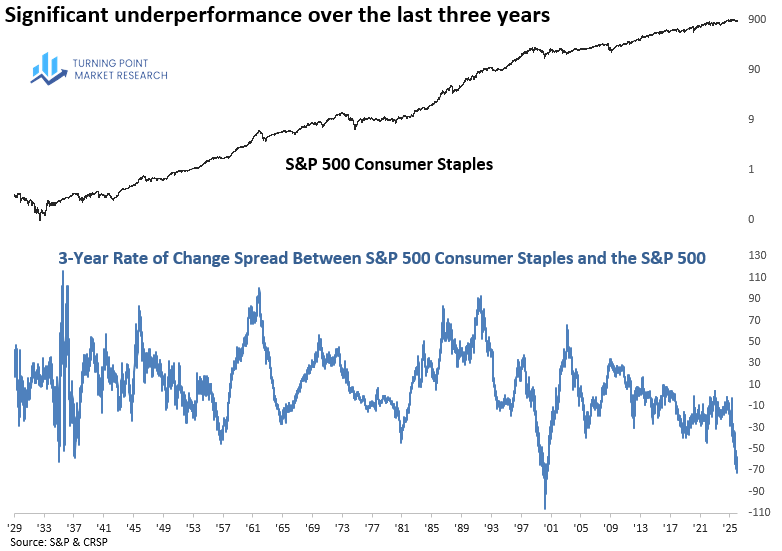
Each week, we examine the stock market’s big-picture trends using rolling and net rolling returns across sectors and sub-industries to identify potential outlier behavior. One development that stood out was the three-year rate-of-change spread between consumer staples and the S&P 500, which fell to a new cycle low on Monday—the weakest reading since June 2000. Real estate exhibited a similar breakdown, declining to a new cycle low and reaching its lowest level since May 2000.
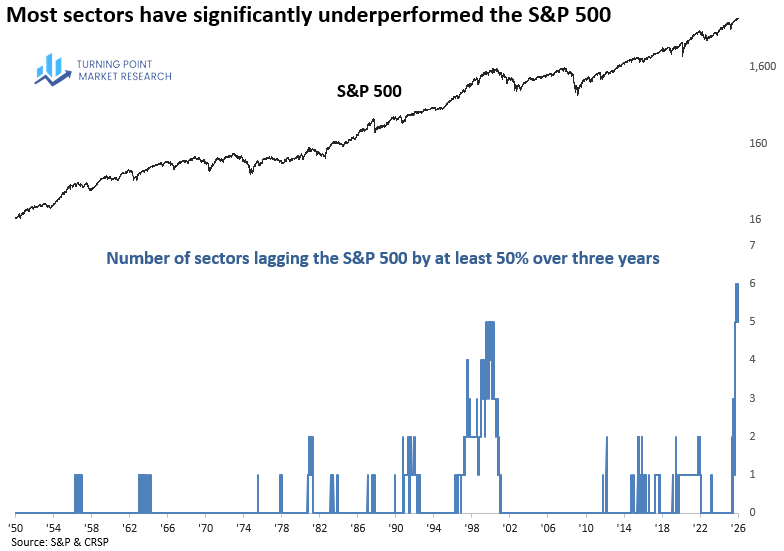
This degree of relative weakness in more than one sector raised a broader question: when have we previously seen such widespread and persistent sector-level underperformance? To address this, we analyzed the number of sectors that underperformed the S&P 500 by at least 50% over a rolling three-year period.
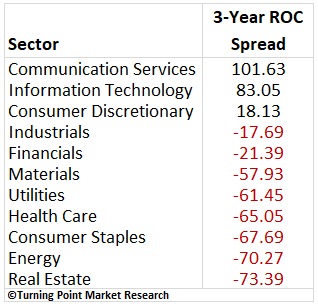
In case you were wondering which groups have lagged the S&P 500 by 50% or more over the last three years, it was commodity-oriented sectors such as energy and materials, along with defensive groups including utilities, health care, consumer staples, and real estate.
In December, the number of sectors lagging the S&P 500 by 50% over three years rose to six groups, exceeding the prior historical extreme observed during the Dotcom era.
Notably, when the count exceeded its prior 1990s peak of two in June 1997, it rose to four before unwinding to one during the 1998 LTCM correction, then ultimately surged to five by July 1999.
Each Chart of the Week highlights a theme, idea, or historic event that stood out to us. If you find it interesting, feel free to share it with friends or colleagues.
Visit www.tpmarketresearch.com to learn more about our research offering.