Use this category for all free content.
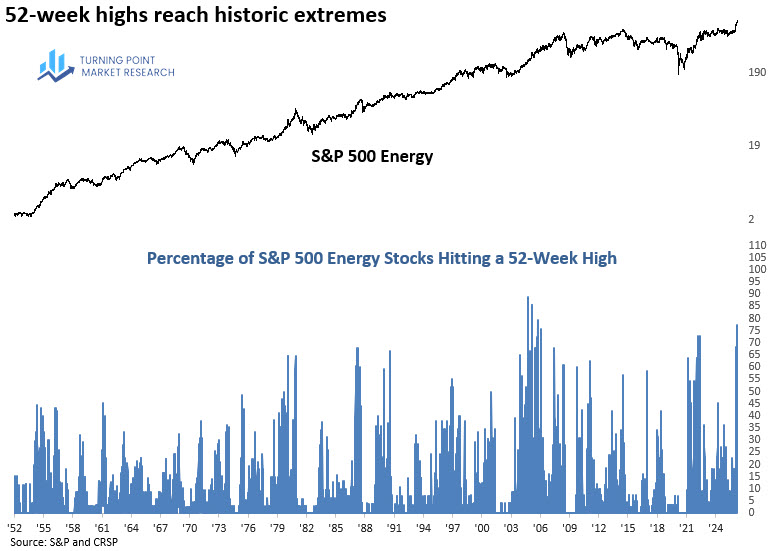
In this week’s Chart of the Week, we examine the surge in energy stocks hitting 52-week highs, a reading that ranks among the most extreme in history.
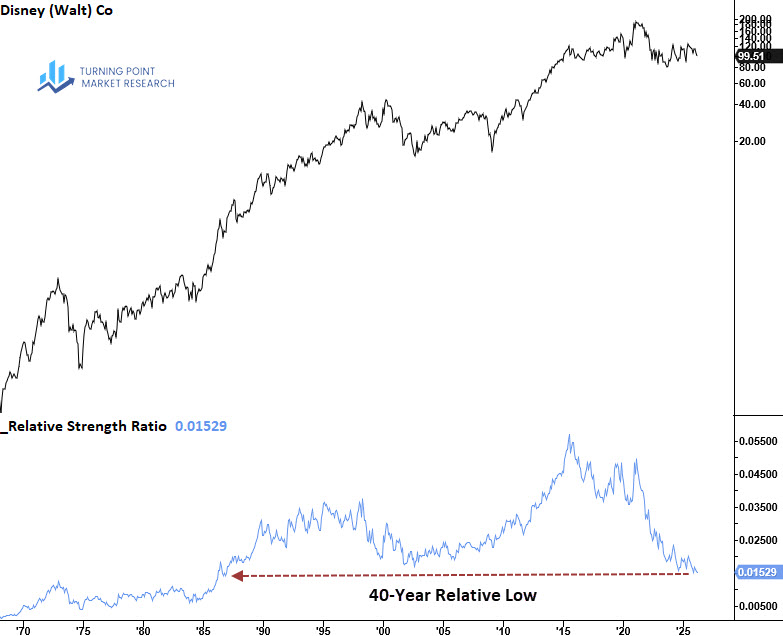
Iconic brand names are underperforming at historic levels. See the big-picture perspective in this week’s Chart of the Week series.
In our chart of the week, we examine the S&P 500 breaching its December 2025 low, analyzing if this is a critical market warning.
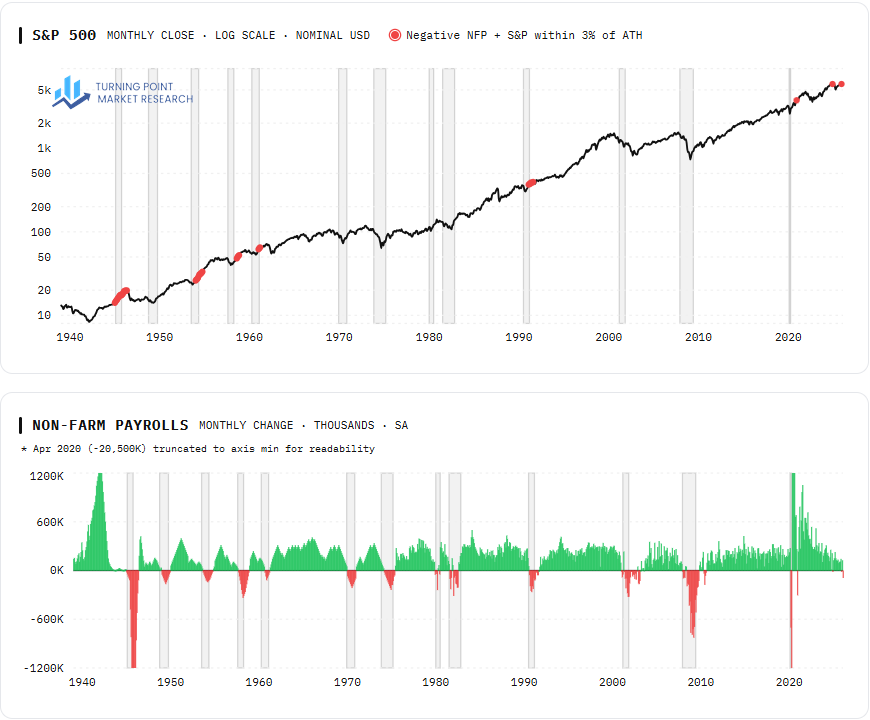
Our latest Chart of the Week highlights the disconnect between a weak jobs report and an S&P 500 trading near record highs.
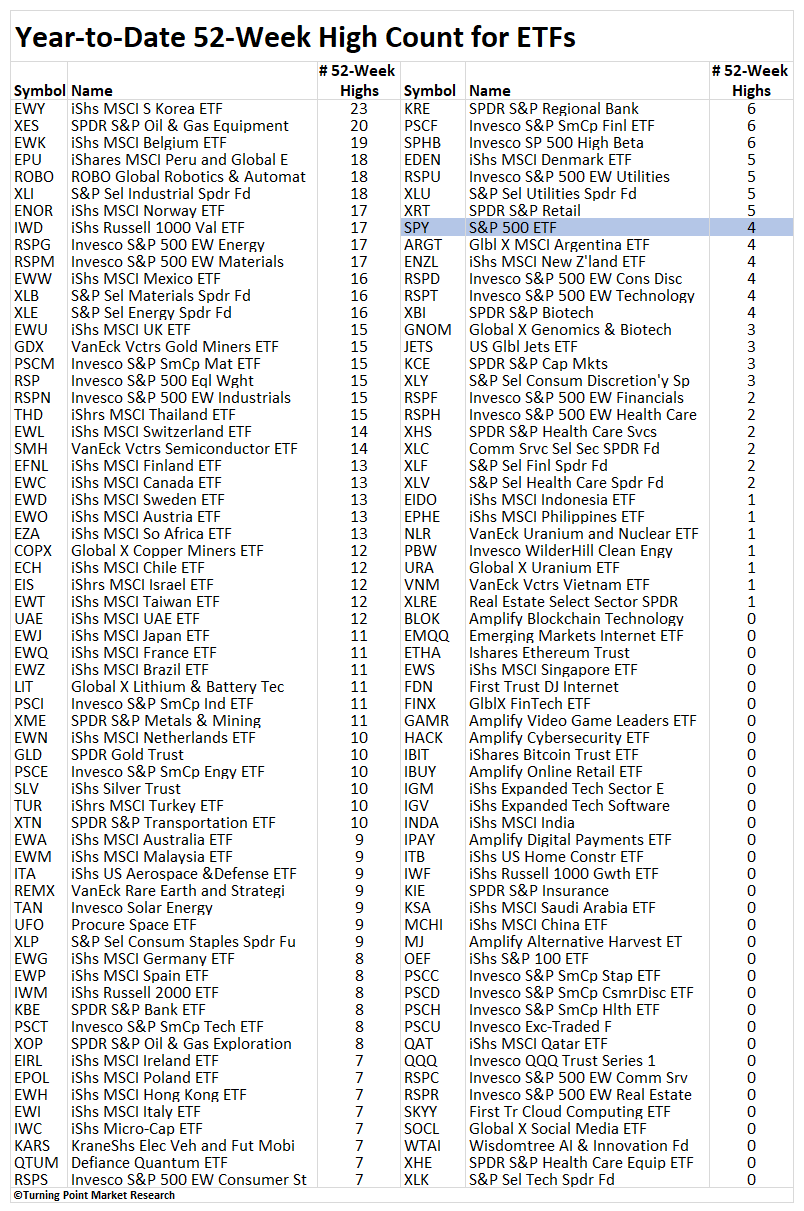
In this week’s Chart of the Week, we highlight leadership trends through the lens of year to date 52-week highs across a wide spectrum of ETFs.
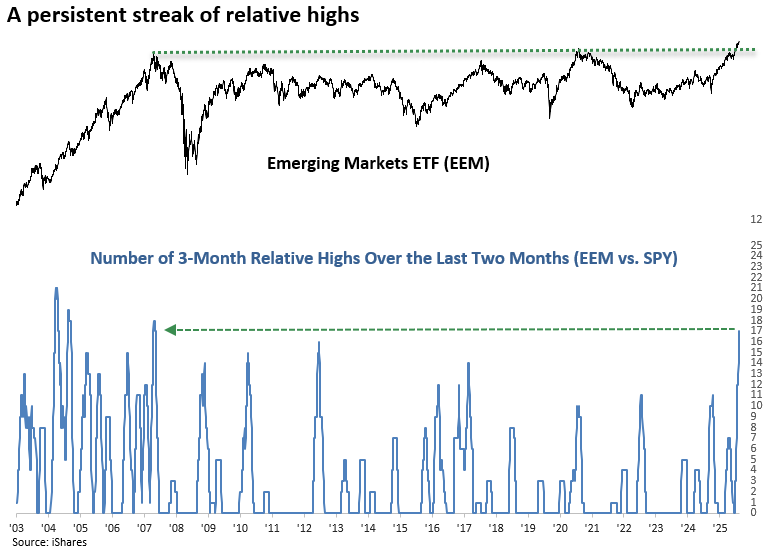
In this week’s Chart of the Week, we analyze a notable shift in the relative strength profile of emerging markets.
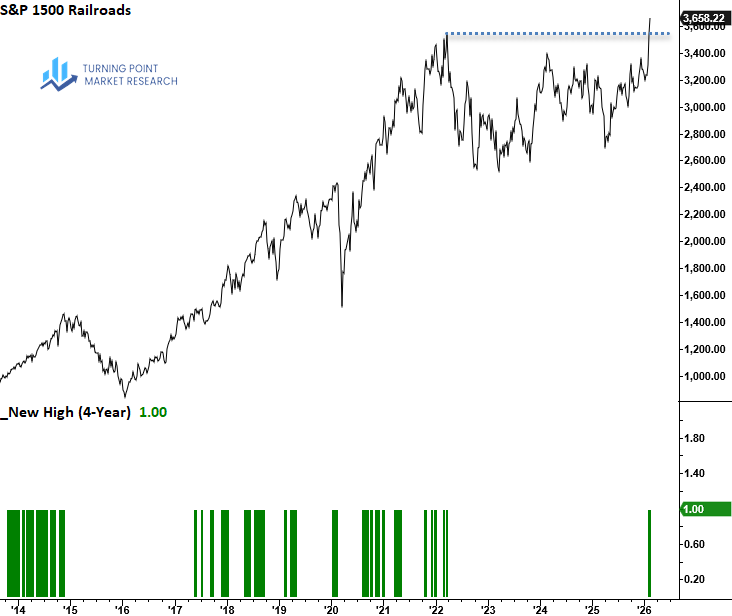
In our latest Chart of the Week series, we examine the railroad industry breakout from a prolonged period of consolidation, a scenario last seen in 2003.
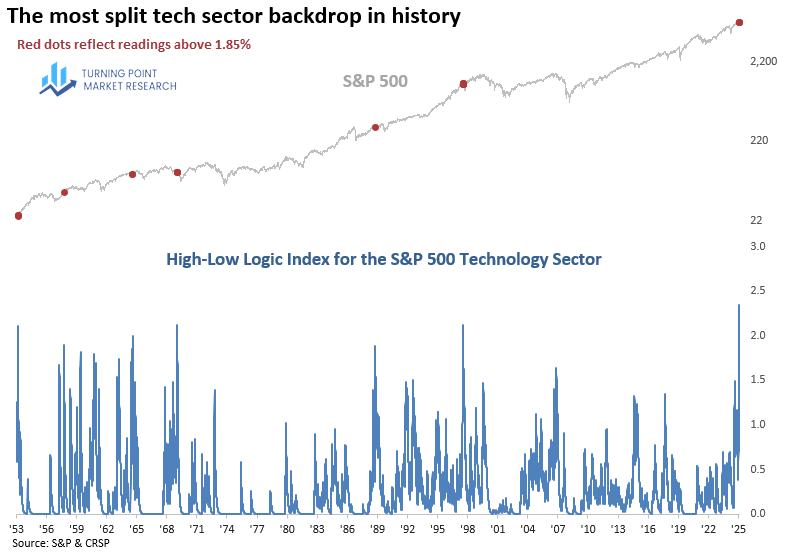
Beneath the surface, the technology sector is increasingly fragmented. Our latest Chart of the Week highlights this divergence and its most recent historical parallel.
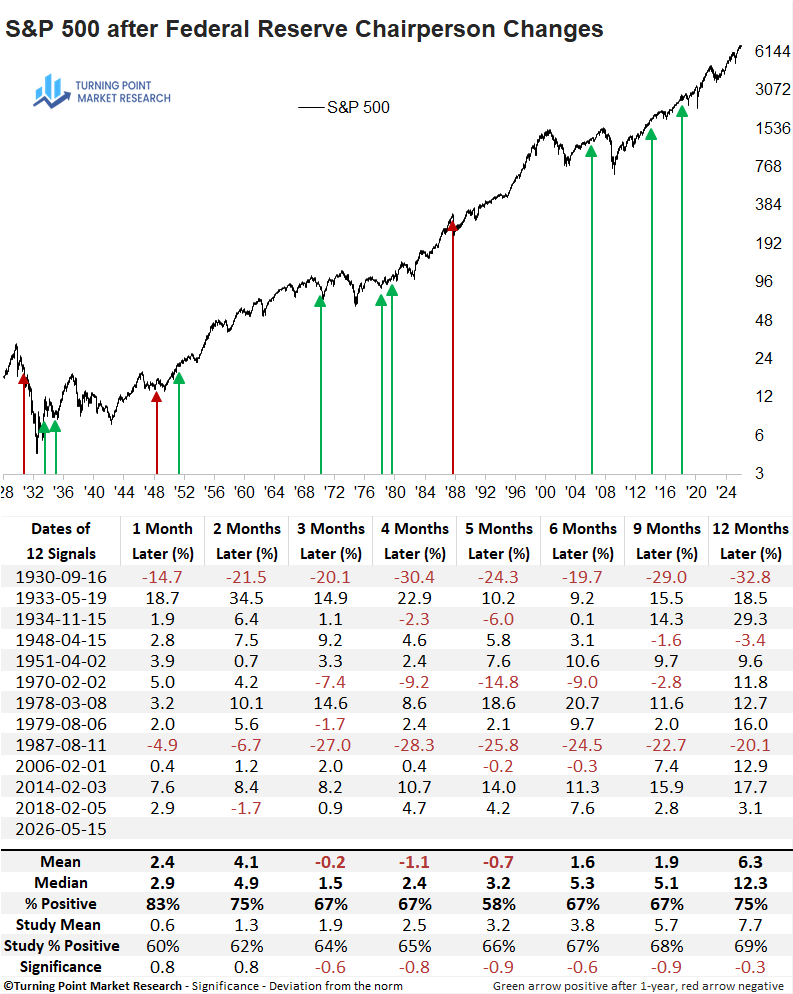
In this week’s Chart of the Week, we examine how the S&P 500 has historically behaved after a new Fed Chair is selected.
Our latest Chart of the Week analyzes surging market breadth in the materials and energy sectors as a commodity index hits a new cycle high.
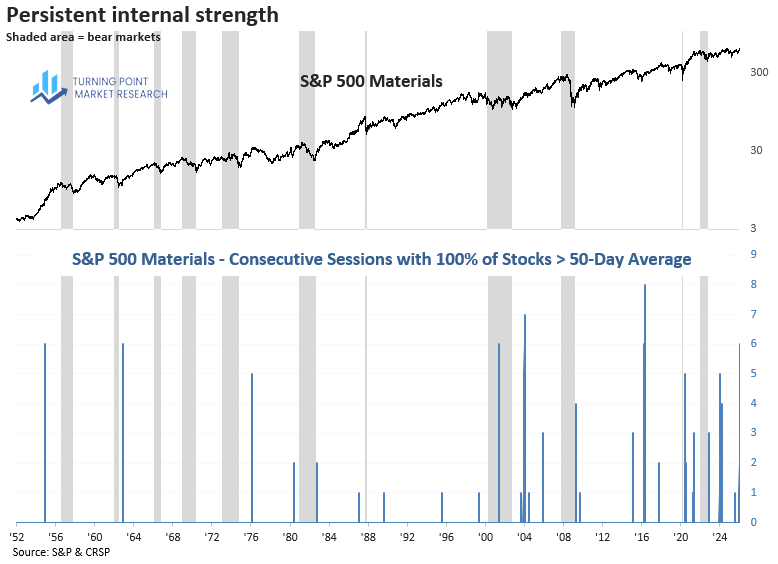
In our latest Chart of the Week series, we examine a market breadth indicator in the Materials sector, showing persistency not seen since 2016.
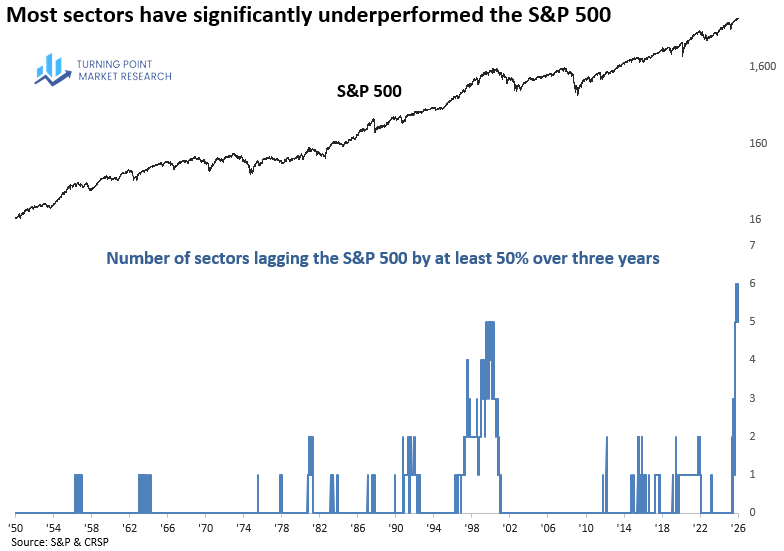
Our latest Chart of the Week examines sector-wide underperformance, revealing a relative trend scenario never before observed in market history.