Use this category for all free content.
Our latest Chart of the Week analyzes surging market breadth in the materials and energy sectors as a commodity index hits a new cycle high.
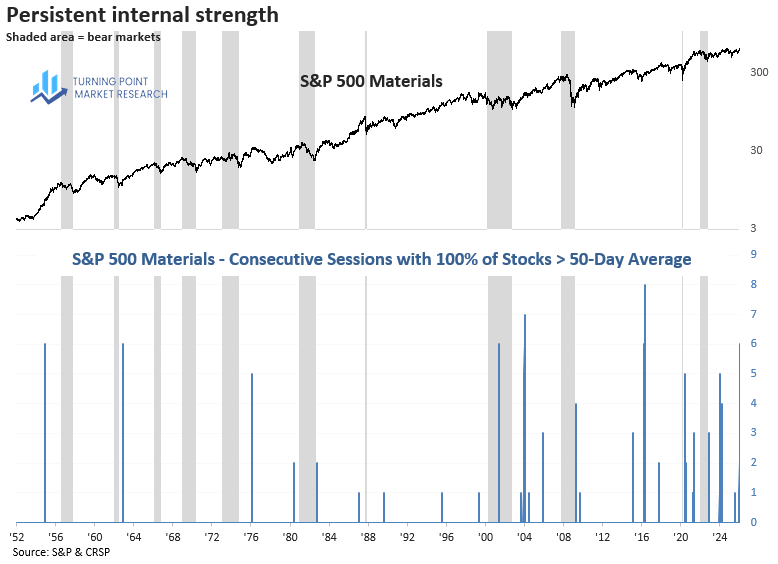
In our latest Chart of the Week series, we examine a market breadth indicator in the Materials sector, showing persistency not seen since 2016.
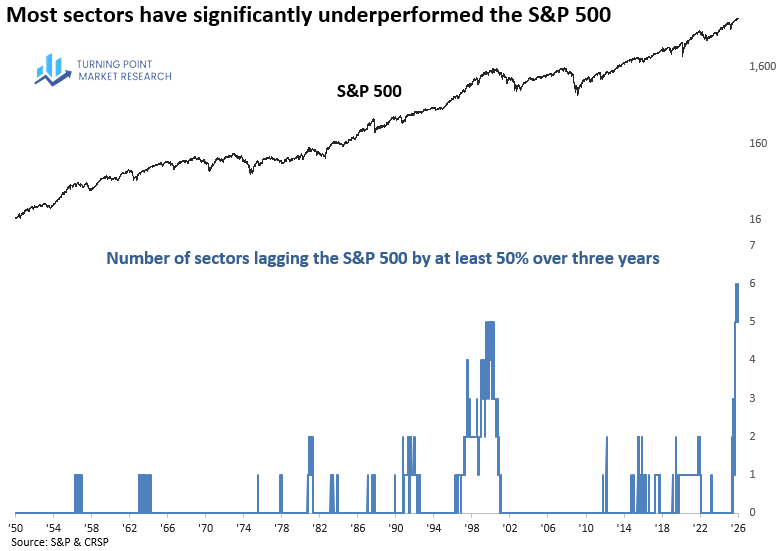
Our latest Chart of the Week examines sector-wide underperformance, revealing a relative trend scenario never before observed in market history.
Semiconductors open 2026 with substantial gains as software stocks sink, suggesting a trend that dominated most of 2025 is set to continue.
Aluminum breaks out, supporting the pro-growth metals theme and indicating cyclical strength across key industrial sectors.
Over the last three weeks, the Dow Jones Transportation Index has seen a significant upswing. How should investors interpret this development?
Copper's monthly close above its ascending triangle pattern confirms a major breakout, signaling the early stages of a new structural uptrend.
Energy remains stuck in a prolonged consolidation phase—see how this setup compares with prior market cycles.
The tech sector has the largest share of stocks in a bear market, revealing a significant disconnect from headline performance.
What does a concentration of new highs in a commodity index indicate about the durability of an uptrend? Discover the answer here.
It’s been another impressive year for the S&P 500, with the world’s most benchmarked index recording 36 all-time highs year to date. Even more notable is that 31 of those…
The Chart of the Week series intends to share a theme, idea, or event that caught my eye—and nowhere was that more evident this week than in the remarkable outperformance…