Airline Industry Takes Flight
In our latest chart of the week series, we spotlight a key transportation industry that has broken out to new all-time highs.
Comments Off on Airline Industry Takes Flight
June 27, 2026


Use this category for all free content.
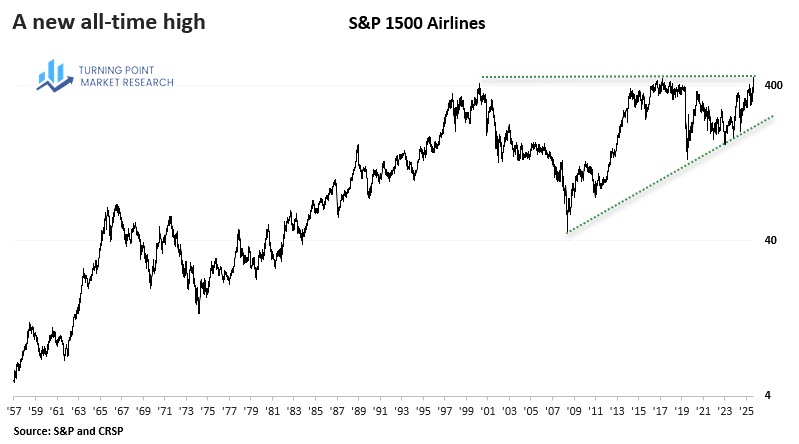
In our latest chart of the week series, we spotlight a key transportation industry that has broken out to new all-time highs.

Our latest Chart of the Week series explores the remarkable run in South Korean equities.

In this week's Chart of the Week, we examine the persistent strength in transportation stocks, highlighted by a steady stream of annual highs.
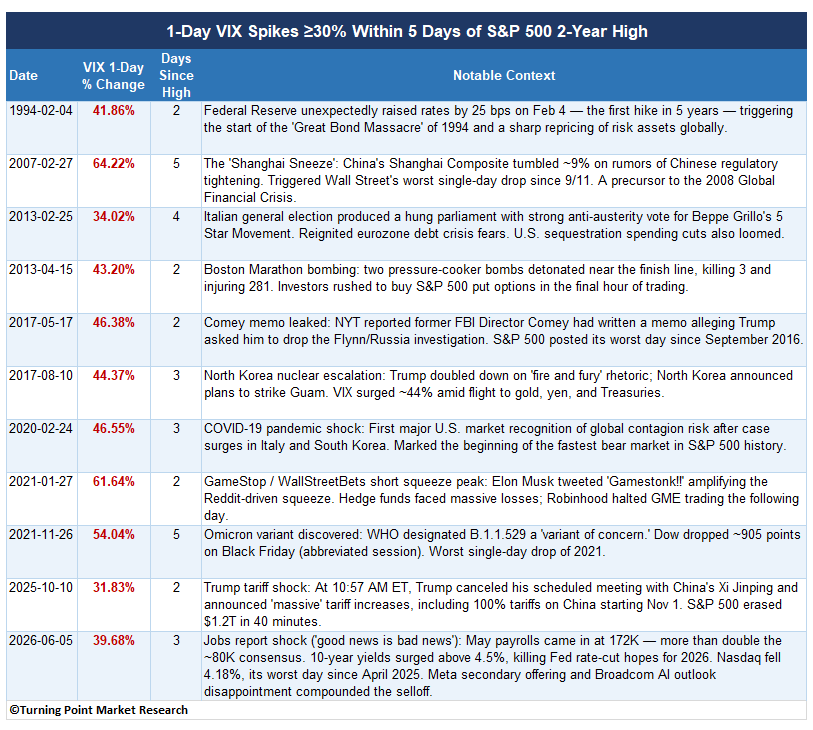
In our latest Chart of the Week, we examine significant volatility surges as the S&P 500 hovers near a multi-year high.

Our latest Chart of the Week explores the frequency of 5% daily gains and places today’s market activity in context with the Dotcom-era experience.

In our latest report, we examine broad-based underperformance in defensive industries, a consistent feature of bull market regimes.
In this week’s Chart of the Week series, we examine the extended period of weak long-term trend conditions among S&P 500 constituents.

In this week’s Chart of the Week, we explore rolling net returns across sectors and sub-industries versus the S&P 500 to assess what groups are leading and lagging.

In our latest Chart of the Week series, we examine the number of annual breakouts for a commodity index.

In our latest Chart of the Week series, we examine the implications of a historic semiconductor rally and what it may signal for the industry going forward.

In our latest Chart of the Week, we examine the rebound in the spread between 52-week highs and lows for junk bonds and its implications for stocks.
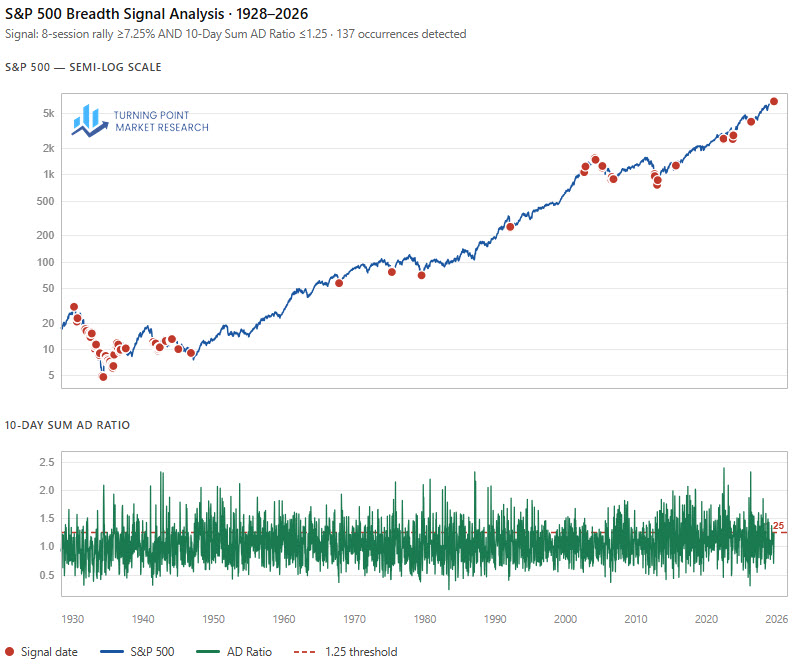
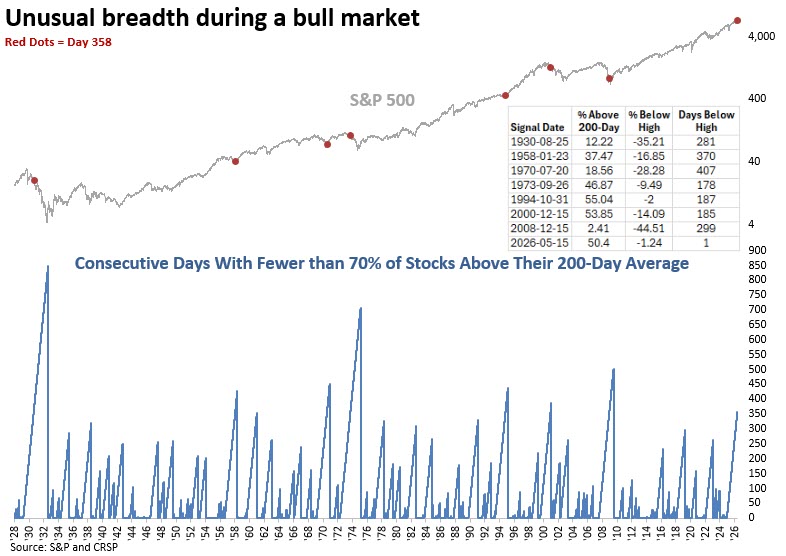
In the latest installment of our Chart of the Week series, we analyze weak breadth conditions alongside a strong rally in the S&P 500.