

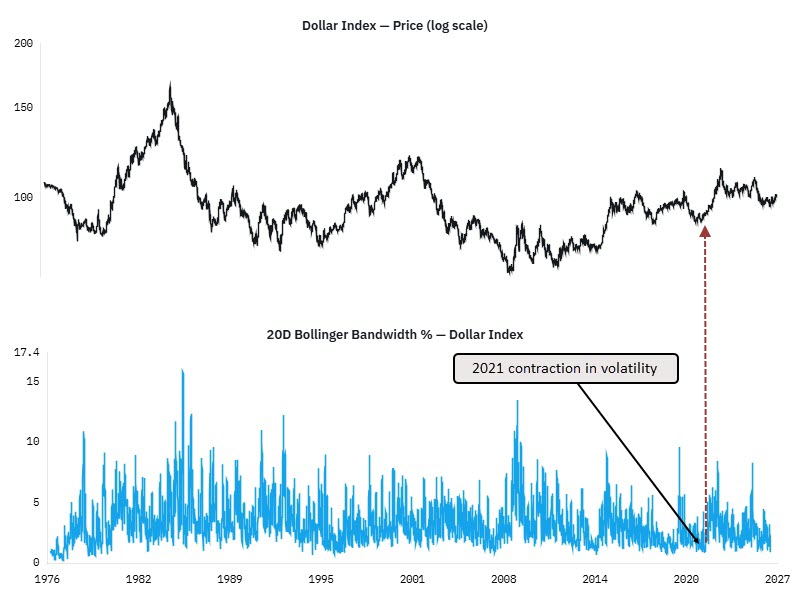
Each week I monitor volatility across a universe of more than 185 indexes, sectors, industries, sub-industries, and other assets by measuring the spread between the upper and lower Bollinger Bands. Bollinger Bands, developed by John Bollinger, are a popular way to measure volatility. When the bands widen, volatility is increasing. When they narrow, volatility is drying up. While reviewing the latest readings, one chart immediately caught my attention—the U.S. Dollar Index (DXY). Its Bollinger Band spread has compressed to only 0.93%, a reading that ranks in just the 4th percentile of all observations dating back to 1972. That’s an unusually quiet market.
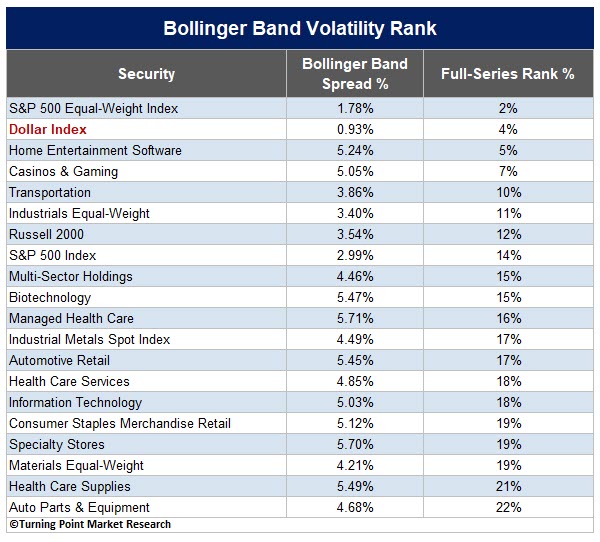
Even more interesting, the spread has fallen to its lowest level since December 2021, right before the dollar launched into a major advance as the Fed embarked on its 2022 tightening campaign. While volatility compression doesn’t predict direction, the historical backdrop suggests the current period of calm may not last much longer. As a reminder, the Federal Reserve meets next week.
Each Chart of the Week highlights a theme, idea, or historic event that stood out to us. If you find it interesting, feel free to share it with friends or colleagues.
Visit www.tpmarketresearch.com to learn more about our research offering.