
At first glance, Friday’s selloff looked like nothing more than a normal pause following the market’s steady climb from the March 30 low. As the session unfolded, however, it became clear that this was far more than a routine pullback. Stocks came under heavy pressure, with technology shares—arguably the market’s leadership group—bearing the brunt of the selling.
What stood out most was the behavior of the Volatility Index (VIX), often referred to as the market’s fear gauge. The VIX surged 39%, an unusually large move occurring just shy of a market high. That raises an important question: what message, if any, has history suggested when fear rises so dramatically near the peak of an advance?
Looking back to 1990, we identified only 10 prior occasions when the VIX jumped at least 30% within five trading sessions of a multi-year high. Using AI-assisted research, we compiled the table below to place these rare signals into historical perspective. In general, these volatility spikes have tended to coincide with news-driven events.
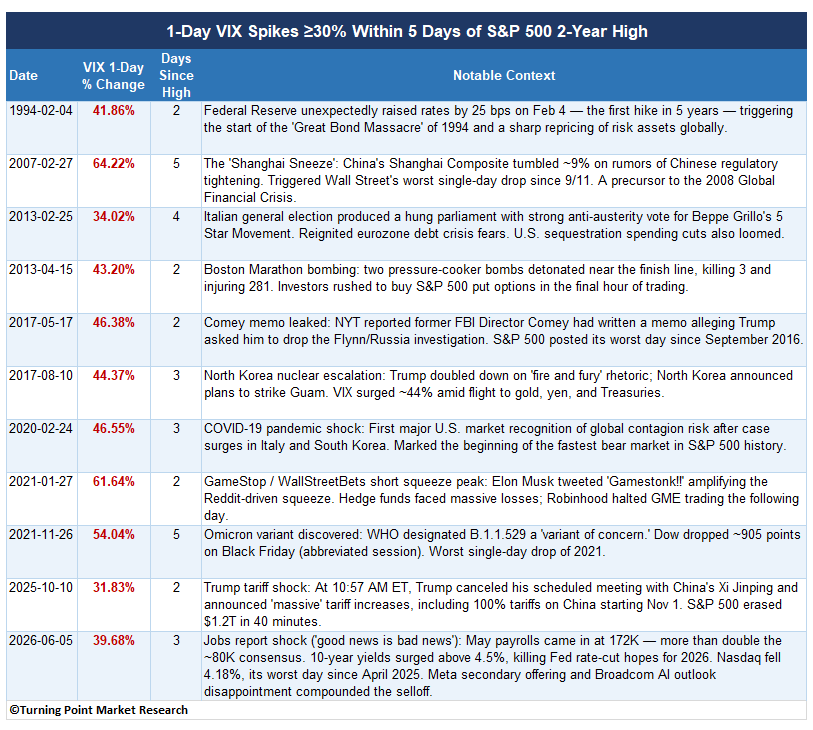
For subscribers, I’ll dive deeper into these rare occurrences in Monday’s report and examine what history suggests could be next for the S&P 500.
Each Chart of the Week highlights a theme, idea, or historic event that stood out to us. If you find it interesting, feel free to share it with friends or colleagues.
Visit www.tpmarketresearch.com to learn more about our research offering.