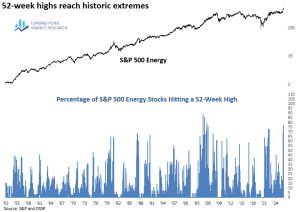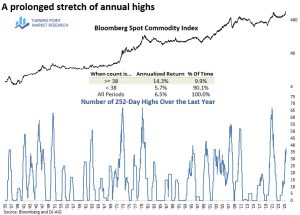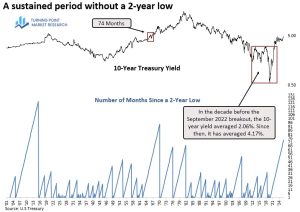


Consumer discretionary has been one of the weakest areas of the market for quite some time. Pinpointing the exact cause is difficult, but if I had to venture a guess, the prolonged period of elevated interest rates—the longest since the last secular uptrend in yields—has likely weighed on consumer groups. Periodic inflationary pressures, whether driven by higher energy prices or tariffs, have only added to those headwinds.
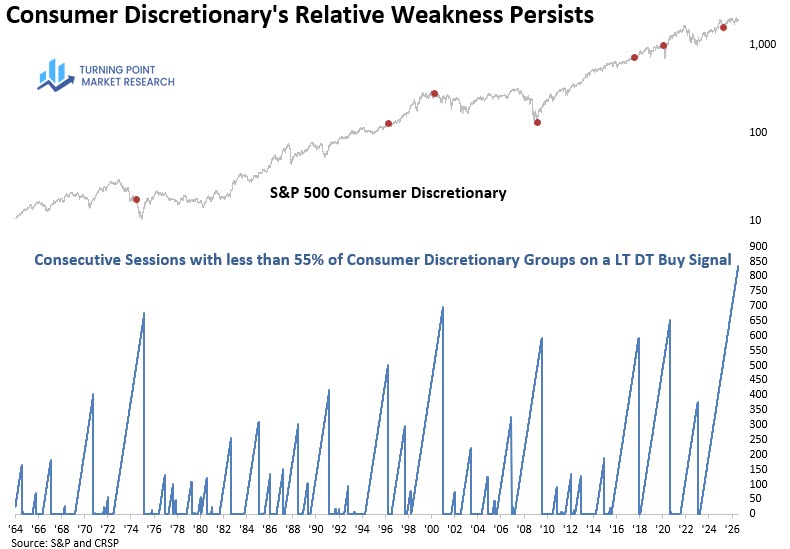
The chart below illustrates this weakness by tracking the percentage of consumer discretionary sub-industry groups on a long-term Dual Trend buy signal. After surging to 81% coming out of the 2022 bear market, a common characteristic when cyclical sectors emerge from major declines, participation has steadily deteriorated. In fact, the reading fell to 0% in May and has only recovered to 7% today.
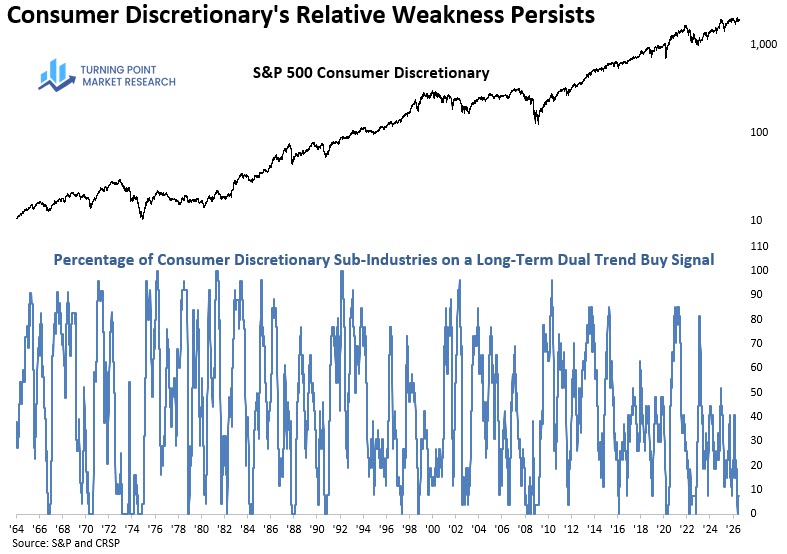
More notably, the percentage has remained below 55% longer than at any point in history. The red dots on the chart identify each instance when the percentage stayed below 55% for 500 consecutive days.
Each Chart of the Week highlights a theme, idea, or historic event that stood out to us. If you find it interesting, feel free to share it with friends or colleagues.
Visit www.tpmarketresearch.com to learn more about our research offering.