
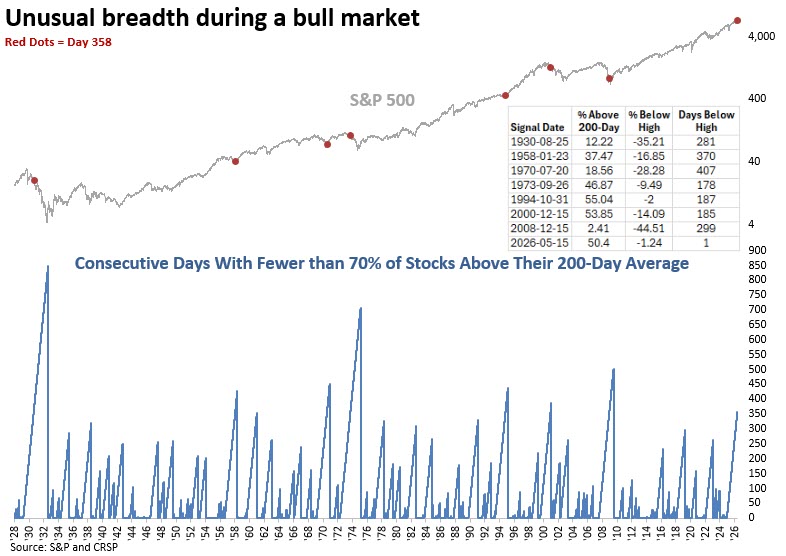
Despite the S&P 500 recording 18 all-time highs year-to-date — including 14 within the last month — underlying trend participation remains surprisingly weak.
As of Friday, only 50% of S&P 500 constituents were trading above their 200-day moving averages, a widely followed measure of long-term trend health. More notably, the percentage has now remained below 70% for 358 consecutive sessions — the eighth-longest streak on record.
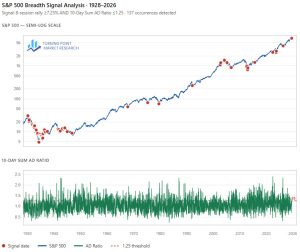
That naturally raises an important question: when have we seen similarly prolonged stretches of weak trend participation beneath a rising index?
Let’s zoom out and examine the historical record.
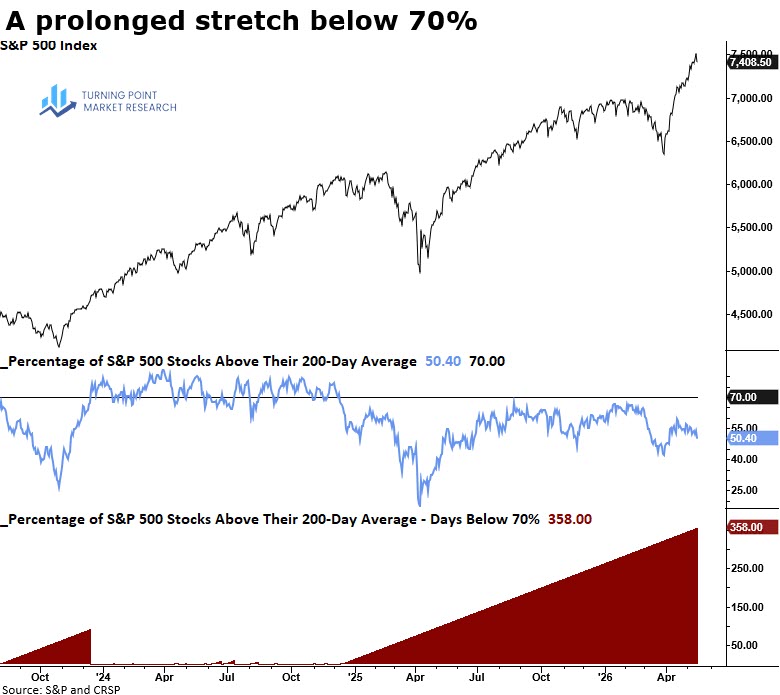
As the chart below illustrates, in all but one case—1994—when fewer than 70% of stocks were above their 200-day moving averages for 358 consecutive sessions, the S&P 500 was in a bear market.
Each Chart of the Week highlights a theme, idea, or historic event that stood out to us. If you find it interesting, feel free to share it with friends or colleagues.
Visit www.tpmarketresearch.com to learn more about our research offering.