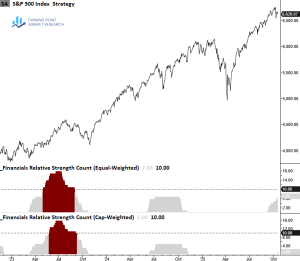

Since the S&P 500 bottomed on March 30, the benchmark index has surged 7.46% over just eight sessions, with gains in seven of those days. While the velocity of the move is notable, what stands out even more is the lack of confirming breadth—an unusual divergence for such a persistent rally. This raises an important question: when have we historically seen advances of this magnitude without broad participation beneath the surface?
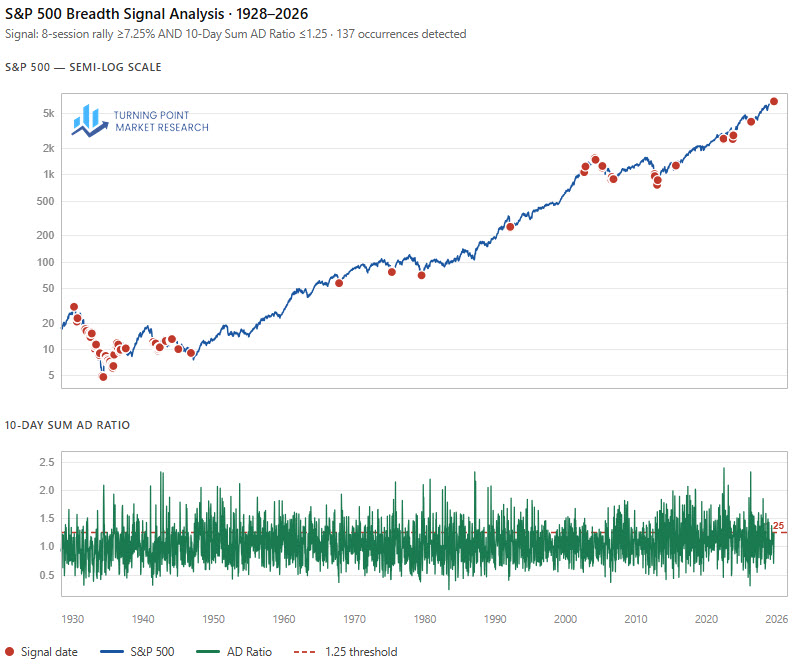
Applying the Breakaway Momentum indicator popularized by Walter Deemer, we isolate periods when the index gained at least 7.25% over eight sessions while the 10-day advance-decline ratio remained subdued at 1.25 or less, matching Friday’s reading.
As shown by the red dots in the chart below, these rare occurrences have predominantly clustered during bear markets or near major peaks, including episodes surrounding 1929 and 2000. The current instance underscores the atypical environment shaped by the Iran conflict, where extreme dispersion has driven a sharp divide between winners and losers.
Each Chart of the Week highlights a theme, idea, or historic event that stood out to us. If you find it interesting, feel free to share it with friends or colleagues.
Visit www.tpmarketresearch.com to learn more about our research offering.