

There has been considerable discussion about the NYSE McClellan Summation Index’s oversold reading, a market breadth indicator that measures how broadly stocks are taking part in a market move over the medium to long term. The bullish argument is that the indicator hit an oversold level, suggesting stocks are due for a rebound. But how can the Summation Index flash a washed-out condition when the S&P 500 is just 0.1% below its record high?
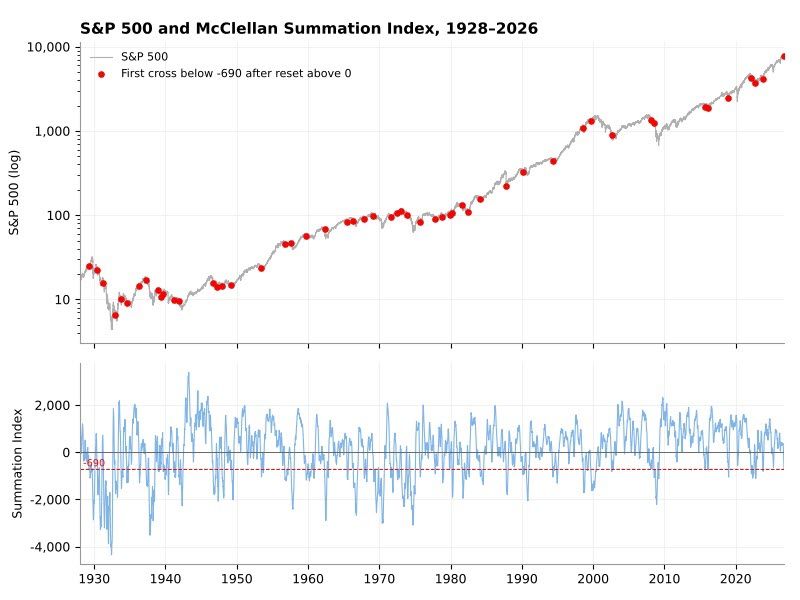
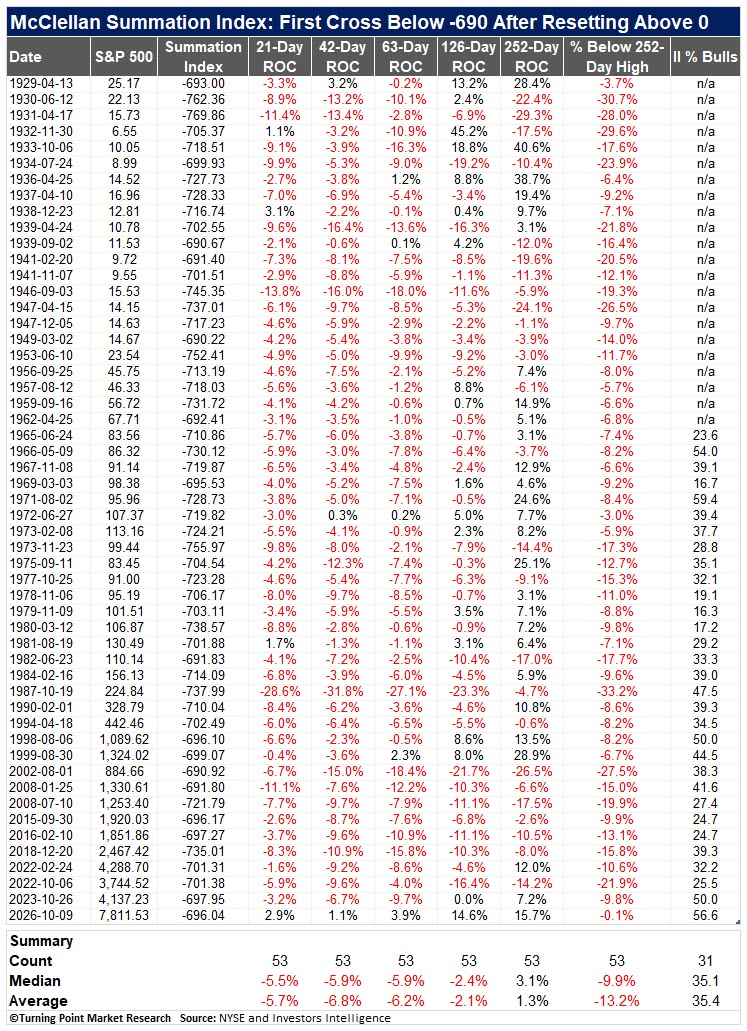
To better understand the backdrop, I examined every historical instance in which the McClellan Summation Index first fell below -690 after resetting above zero, comparing price momentum and sentiment at each point in time.
The 2026 reading is unprecedented among these historical cases. Previous occurrences generally coincided with an S&P 500 correction or bear market, characterized by negative price momentum and bearish sentiment. Today’s backdrop is the opposite: momentum is positive across every time horizon, and sentiment remains optimistic.
Given this stark contrast, caution is warranted when concluding forward stock returns.
Each Chart of the Week highlights a theme, idea, or historic event that stood out to me. If you find it interesting, feel free to share it with friends or colleagues.
Visit www.tpmarketresearch.com to learn more about our research offering.