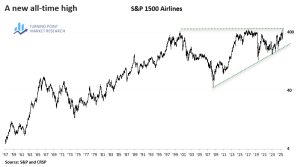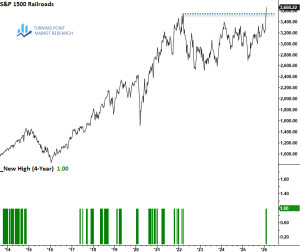

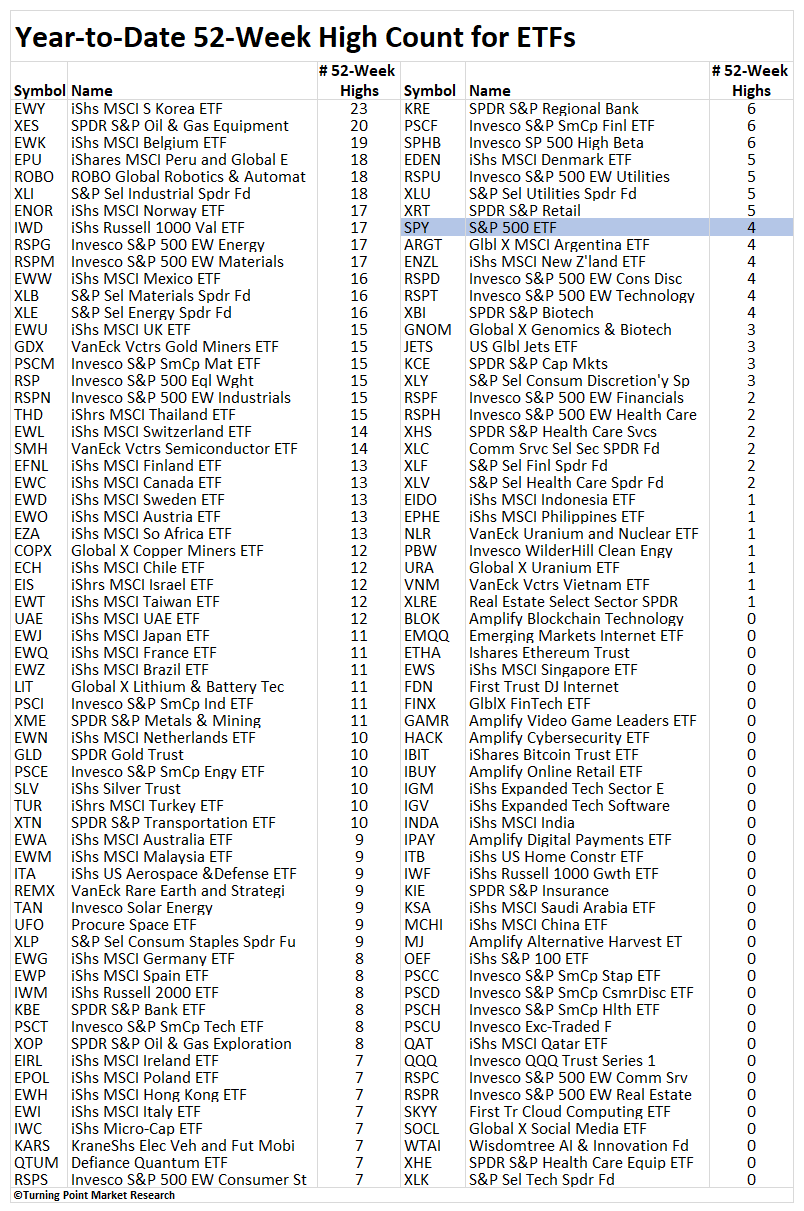
Through the first two months of the year, the S&P 500 has notched a 52-week high on four occasions, tying for the 34th-highest total in the 59 years since 1928 when the index was positive through February. Yet the more meaningful development has occurred beyond the world’s most benchmarked index, where a broader array of sectors, industries, thematic groups, and international markets has been recording 52-week highs at a steadier and more persistent pace.
International equity ETFs, particularly those tracking single-country markets in Asia and Europe, have shown the strongest momentum, with EWY (South Korea) leading with 23 YTD 52-week highs. Domestic cyclical and value-oriented sector ETFs have also shown strong participation in the high count, consistent with a broader rotation away from growth-oriented groups.
Each Chart of the Week highlights a theme, idea, or historic event that stood out to us. If you find it interesting, feel free to share it with friends or colleagues.
Visit www.tpmarketresearch.com to learn more about our research offering.