

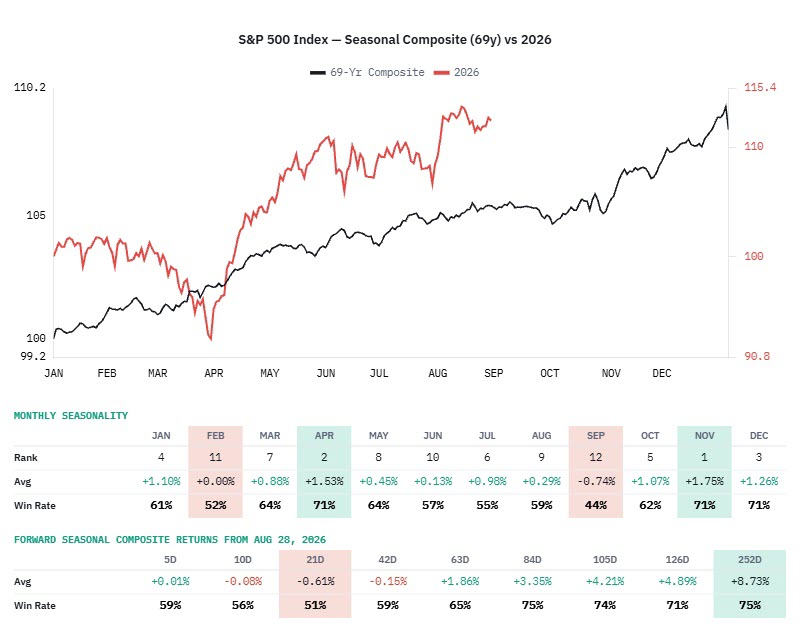
As August draws to a close and September approaches, it seems like an appropriate time to revisit some seasonal trends. September has historically ranked as the weakest month of the year for equity indexes. That said, seasonality should never be used as a standalone indicator, but rather as one component of a broader weight-of-the-evidence approach.
Over the past 69 years, September has ranked as the S&P 500’s worst month, producing an average return of -0.74% and a positive return just 44% of the time. However, with November ranking as the best month of the year, the historical pattern suggests investors have ultimately been rewarded for buying weakness during September.
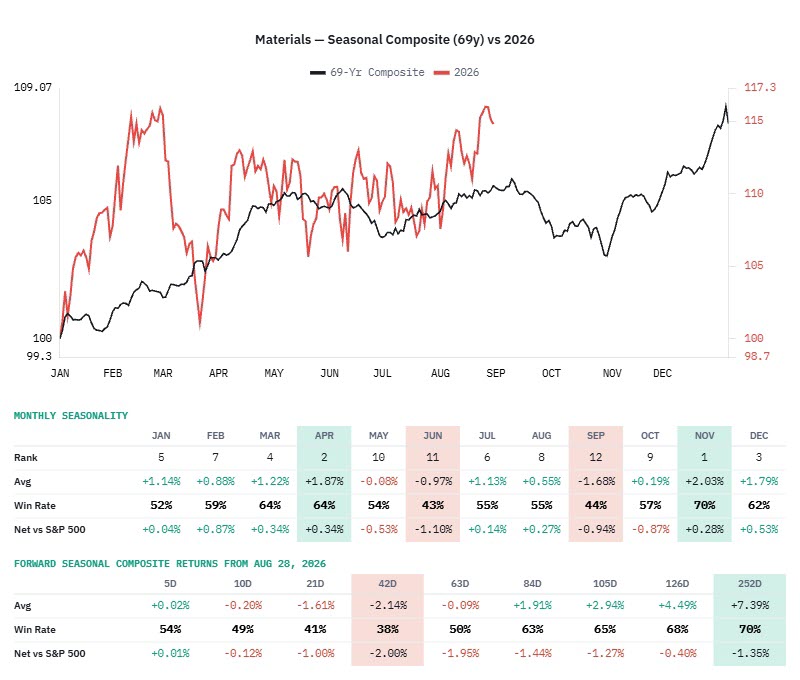
Materials ranks among the weakest-performing sectors in September, averaging a 1.68% decline and an average relative loss of 0.94% versus the S&P 500.
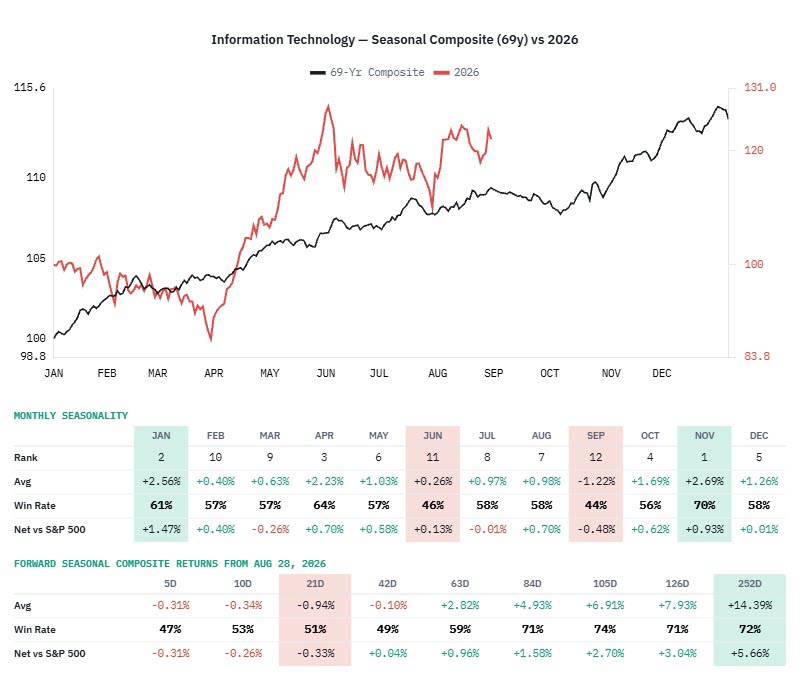
Technology also ranks among the weaker-performing sectors, with an average September loss of 1.22% and an average net loss of 0.48% versus the S&P 500.
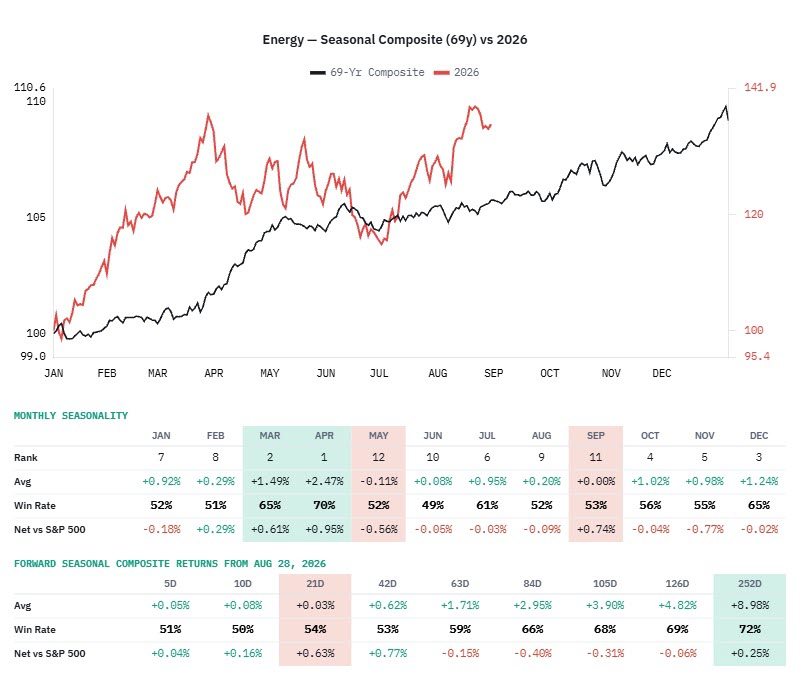
While September ranks as the second-weakest month of the year for energy, trailing only May, the sector has historically posted a flat return and outperformed the S&P 500.
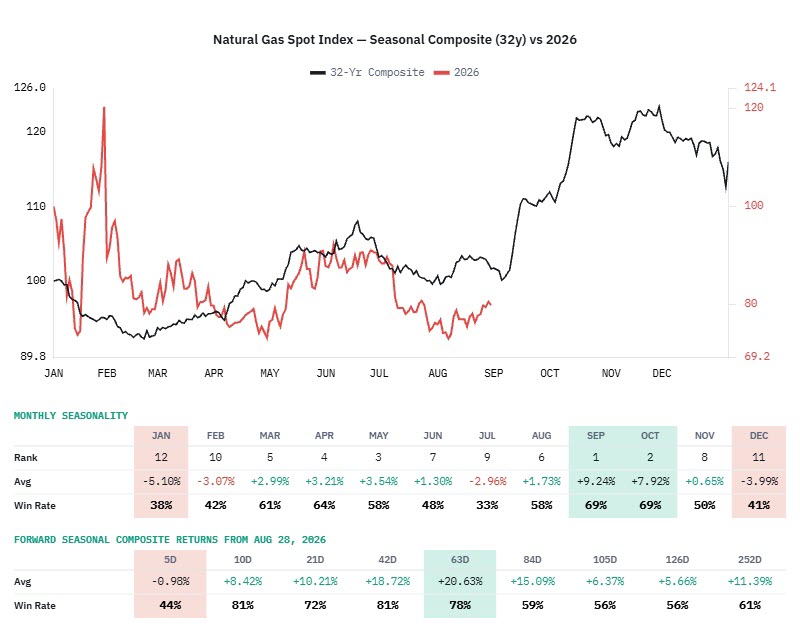
A seasonality ranking system spanning multiple time horizons, measured from the most recent day forward based on historical trends, shows natural gas has rallied 81% of the time over the next two months with an average gain of 18.72%.
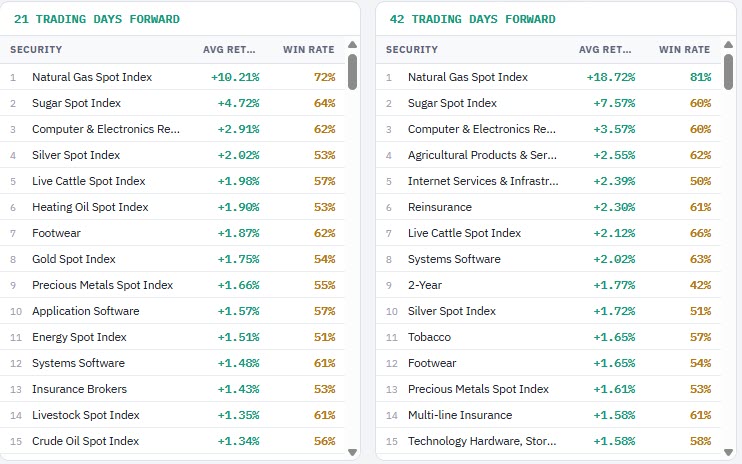
Natural gas tends to follow a well-defined seasonal pattern, with its strongest period of the year just ahead.
Each Chart of the Week highlights a theme, idea, or historic event that stood out to us. If you find it interesting, feel free to share it with friends or colleagues.
Visit www.tpmarketresearch.com to learn more about our research offering.