
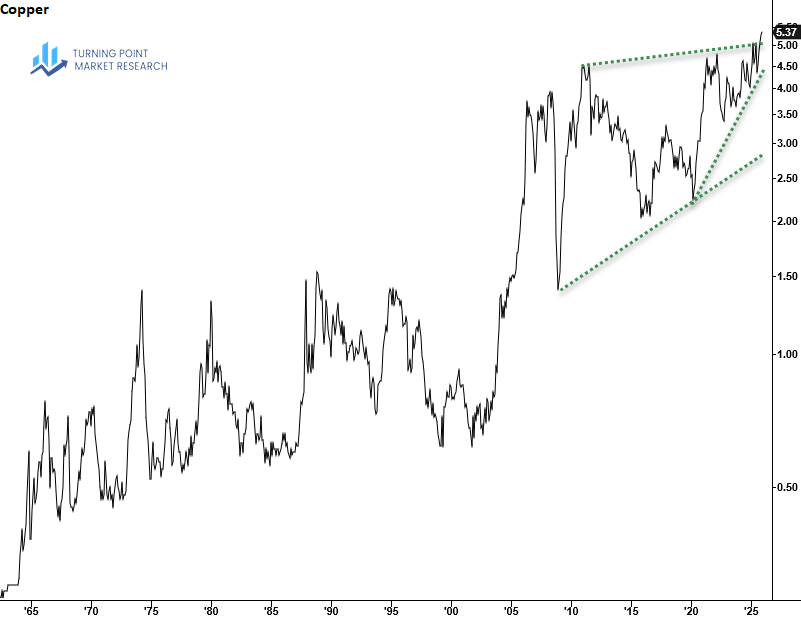
Copper has broken out of an ascending triangle pattern on the monthly chart, signaling the beginning of a new uptrend.
It’s worth noting that the last significant advance from 2002–05 established an entirely new, higher trading shelf—lifting copper out of the multi-decade range that had persisted since the 1970s.
This latest breakout raises the question of whether another repricing is underway. With AI data center construction and global electrification driving demand, the commodity could be at the early stage of forming a higher range, potentially shifting into a $5–$10 band.
Every significant rally in the past has taken the 3-year rate of change above the 1.5 standard deviation band, currently marked at 112%. At 43% today, the current return remains far below that level, implying room to run.

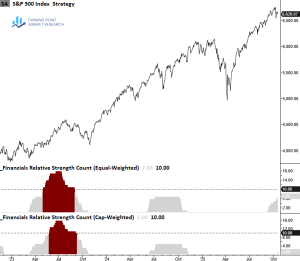
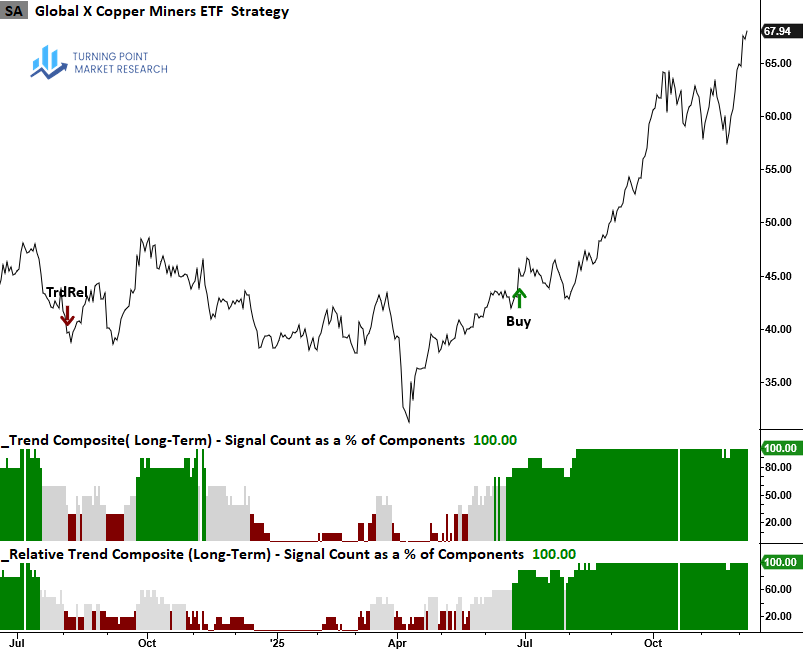
Our dual-trend system flagged the Copper Miners ETF (COPX) in June. Since then, it has outperformed the S&P 500 by 36%. With both the trend and relative-trend composites at a max-bullish 100% and copper’s breakout suggesting further upside, COPX has the potential to be a market leader again in 2026.
Each Chart of the Week highlights a theme, idea, or historic event that stood out to us. If you find it interesting, feel free to share it with friends or colleagues.
Visit www.tpmarketresearch.com to learn more about our research offering.